Originally Published Summer 2020
It has been 5 years since we undertook an in-depth study of Start-Up Incubator Economics (See Start-Up Incubator Economics Revisted)
That study coincided with YCominator's 10th birthday. This year YCombinator turns 15. So let's take the opportunity to revisit the economics of incubators
In that post we discovered the probability of achieving an exit for a start-up graduating from the program dramatically reduces after the first 2 years of operations.
We also concluded the Incubator Factory Complex was not about reducing the rate of failure as a pathway to achieving success. It was all about amplifying it.
So has anything changed?
There is no doubt that YCombinator has radically changed the why the world thinks about germinating ideas into business models… But what about the efficiency of the model?
Are start-up incubators still a recipe for failure? Or, has time proven the original study to be wrong?
Is the model today significantly better than the old Venture Capital seed investment model it professed to disrupt?
Let’s take a look at the big data to separate the facts from the fiction…
The year YCombinator launched (2005) there was also a timely study into 'The Exit Rates of Liquidated Venture Capital Funds' by T Markus Laine (Eqvitec Partners) and Sami Torstila (Helsinki School of Economics) - See PDF of the study here
The authors created a sample of 138 liquidated U.S. venture capital funds and investigate the outcomes of their 4,549 portfolio companies.
In their sample 19% of portfolio companies exited through an IPO, 7% through a sale of listed equity, and 23% through mergers or acquisitions (Basically 49% achieved an exit. Just over half being IPO’s)
If we drill deeper into the study we discover seed stage investors represented 9% of the sample
The average number of portfolio companies of this group was 33 with an average life of 15.4 years
18.6% of seed stage exited via an IPO with a additional 8% listing and then M&A (i.e. 26.6% IPO'd). Add to that M&A exits 24.4%
This equals the average number of exits for seed funds being 51%
Now let’s take a look at YCombinator’s portfolio
The data has been extracted from Seed-DB (See Seed-DB YCombinator)
Analysis of the 2005 to 2011 cohorts reveal >1% of this sub-portfolio have achieved an IPO.
If we include a forecast the potential IPO’s of the remaining companies in the portfolio (e.g. AirBnB & Stripe) we discover that about 2% of the portfolio may achieve IPO status.
This suggests the YCombinator innovation model is about 10x less effective at unearthing IPO’s than the traditional Venture Capital seed investment model.
But what about YCombinator’s ability to achieve any type of exit?
If we look at the cohorts between 2005-2011 we discover 33% of the portfolio have exited to dated.
This would place YCombinator in the bottom 15% percentile of the 2005 research sample.
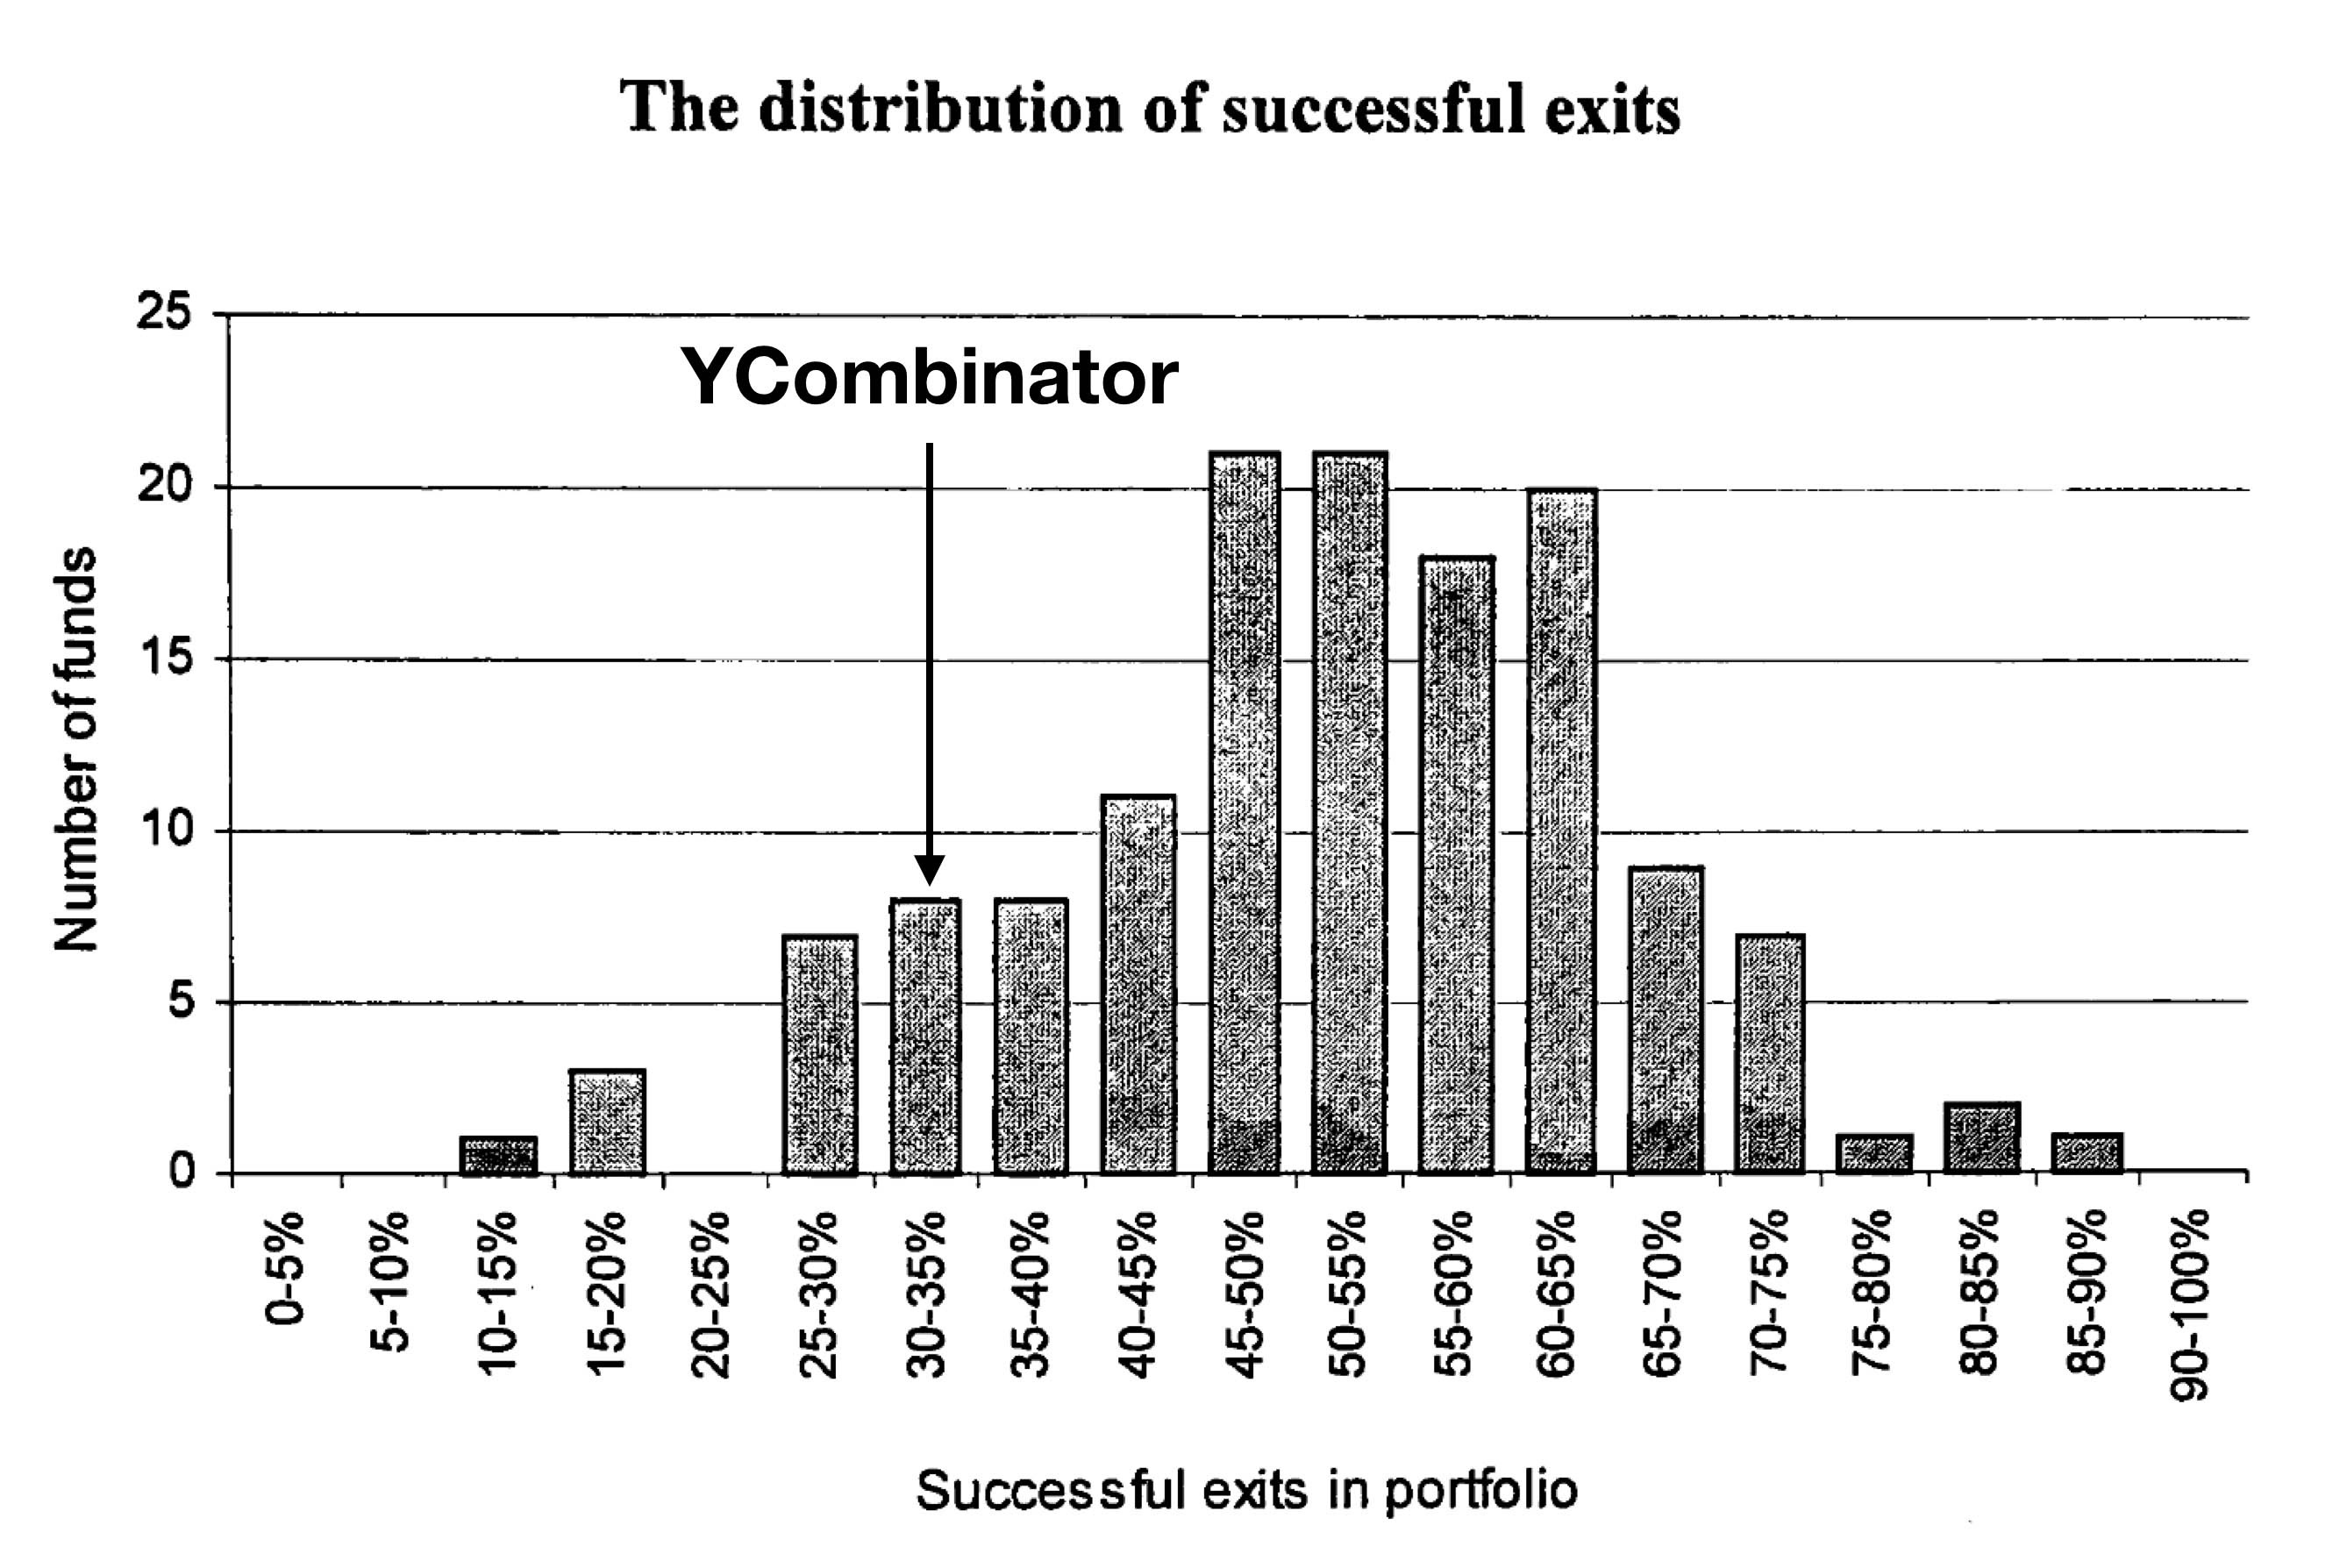
Only the original 2005 cohort achieved the industry benchmark established in the 2005 study.
Now admittedly the potential exists for this figure to rise in the next 5 years but, at the moment, the traditional Venture Capital model appears to be 1.5x more efficient at achieving an exit than the YCombinator model.
If we expand our study to include other popular incubators we discover the same pattern.
For example about 35% of the Techstars pre-2012 portfolio has exited and less than 1% has IPO'd.
Seedcamp has achieved no IPO’s to date and less than 30% of the portfolio has exited.
While of 500 Startups' original 2011 portfolio less than 25% have exited.
The percentage of exits across all startup incubators is just under 15%
This suggests, when it comes to exits, the best of breed start-up incubator model sits uncomfortably within the bottom 15% of Venture Capital portfolio efficiency
While the incubator sector average equates to the lowest bracket of portfolio efficiency
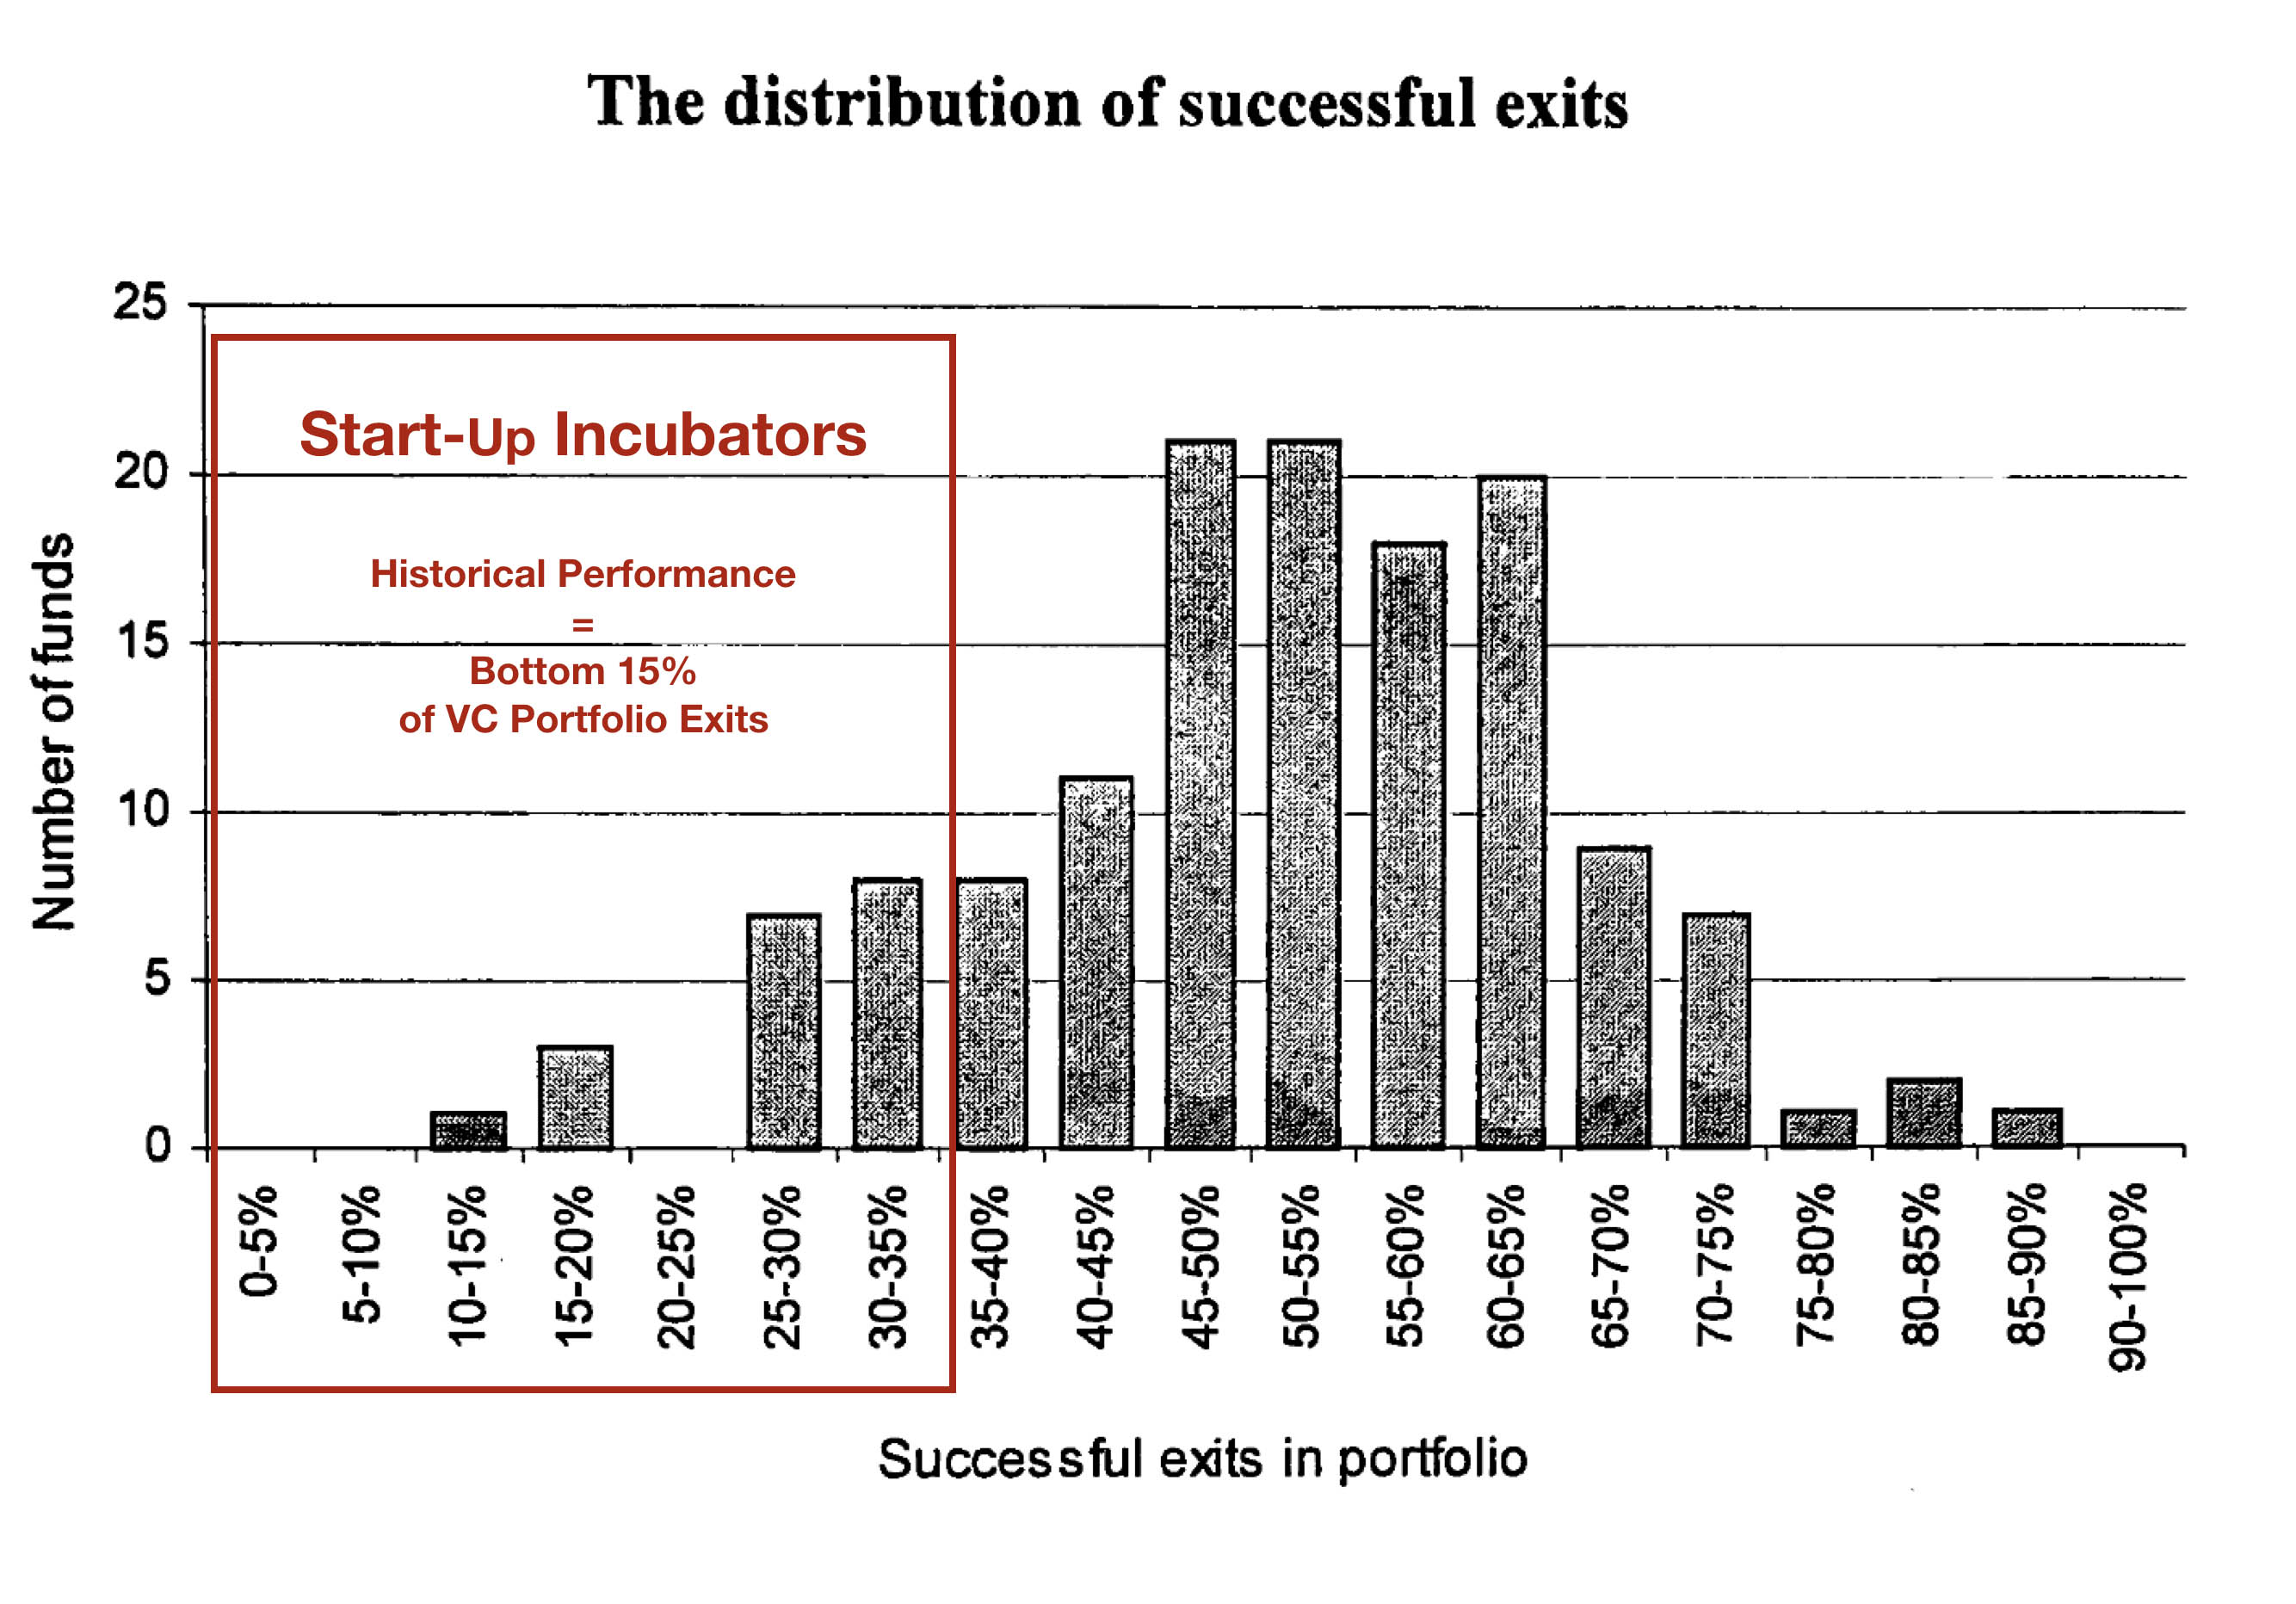
In each case the early success of the original cohort merely meeting - rather than exceeding - the historical benchmark has result in an expansion and ultimately a dilution of the quality of the incubator portfolios.
Now there is of course the opportunity for more exits in the future. But these figures have to be assessed in the context of the longest tech bull run in US history.
And we have to ask the question, given that less than 6.5% of the YCombinator portfolio has achieved an exit today, what happens to the prospects of these start-ups if and when the bull run ends?
I guess we'll know the answer to that question when we revisit the data in 5 years time.
Addendum
Leo Polovets indicated on Twitter the data in the 2005 study does not reflect the current reality for Venture Capital returns at the seed level
Assuming the industry data is unavailable at this time his quick estimates look like this
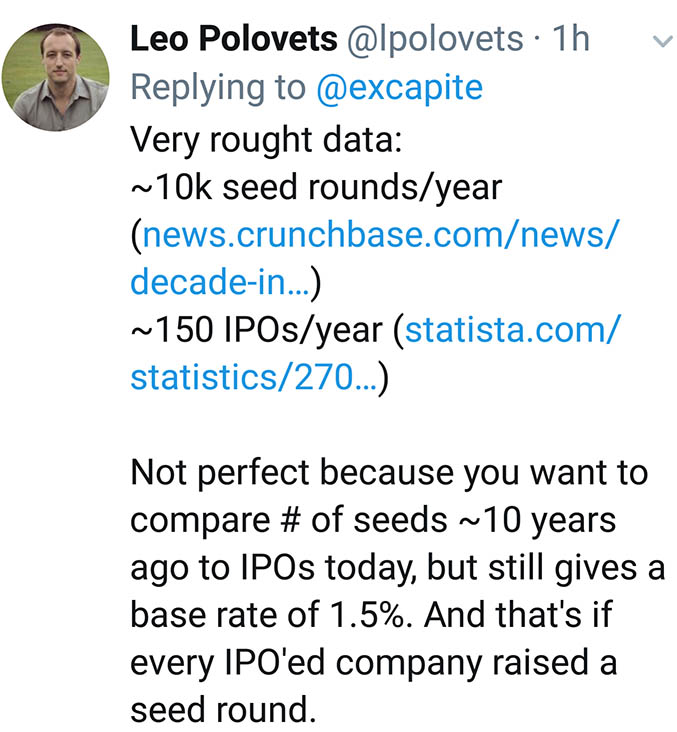
If we adjust these numbers to accomodate an 80/20 split between IPO's that received seed funding or corporate R&D backing vs. those that are bootstrapped we can estimate an industry adjusted average of 1.875% for seed exits
Note: if you assume a 90/10 split the adjusted average is 1.66%
However, using this approach, there is no way to isolate the relative efficiency of the Seed VC model (as opposed to Angel, Corporate VC or other investors) within the market average
But if we compare the incubator/accelerator IPO exit data with this "rule of thumb" calculation we discover the market leaders still fall below the market benchmark for frequency of IPO exists. (Note: (as explained above) this may change in the future)
Likewise if we compare the efficiency of YCombinator's portfolio ratio of 3 IPOs to 1801 Investments against the Founders Fund Portfolio ratio of 5 IPOs to 51 Investments we discover the VC is 59x more efficient at identifying IPO prospects than the Incubator/Accelerator market leader
A closer inspection of the Founders Fund portfolio of investments prior to 2012 indicates 47% of investments have exited to date with 24% of the investments having exited by IPO. (Note: these figures appear to correlate with the numbers published by the 2005 study)
This analysis tends to confirm the original proposition that Seed VC is more efficient at achieving exits than the popular incubator/accelerator factory model
It also suggests the "rule of thumb" 1.5% average is probably skewed by the growth in startups seeded by the factory model
Further Reading
On $300 Billion of Y-Combinator Startup Success
Y-Combinator Top Companies
Postscript - Autumn 2021
In the 18 Months since this post was published it has generated a lot of traffic - Posting over 2500 views
The post was specifically designed to generate feedback from the VC and startup communities on social media
It was anticipated that the collective intellgence of the venture capital community could answer the the question: Why do Startup Incubators fail to compete with pre-2000 Venture Capital investment exits?
After 18 months no correct answer has been published and so here it is...
The key to understanding the economics of the startup incubator model is to acknowledge that it mirrors the performance of the Venture Capital model
Just like every other digital marketplace Venture Capital is a long tail game
The overwhelming majority of VC's (including some of the biggest names in Silicon Valley) are losers - ie they fail to beat investing in the market index
The industry's performance mirrors the long tail of failure of the startups they invest in
Just as there are very few winners in the startup game there are very few winners in the VC game
If we look at the exit performance of YCombinator in terms of exit alue we see the economic reality of investing in the long tail

We also see why any references to industry averages when dealing with a long tail model are redundant
The reality is, for the startup incubator model to achieve outsized ROI, it needs to feed on outsized failure (Just like Venture Capital)
Incubators are in the business of farming/systematizing failure so they can harvest the outliers that survive the odds and deliver random success
This is why it is a game of quantity rather than quality
Indeed the incubator model is specifically designed to accelerate the rate of failure
... and this explains why the exit ratio is below the pre-2000 average
Update: Summer 2021
Radical Insights published a summary of their analysis of 35,568 startups founded between 1990 and 2010
The source of the data was Crunchbase
The key number of interest was the number of IPOs and M&A: 6,856
This indicates an exit rate of 19.3% across the sample
YCombinator delivered a 36% exit rate
Suggesting the YCombinator model is 2x more efficient at achieving overall exits
YCombinator achieved 3 IPOs within the scope of the study. There is no breakdown of the IPO to M&A ratio in the study so we are unable to determine the relative efficiency of YC vs seed VC in relation to IPO exits