This is part two in a series of posts exploring the question: What if our ideas about marketing are all wrong?
What if the 4 P's, the product adoption cycle, the S Curve and the 60:40 Marketing Mix are fundamentally flawed ways of thinking about how it all works?
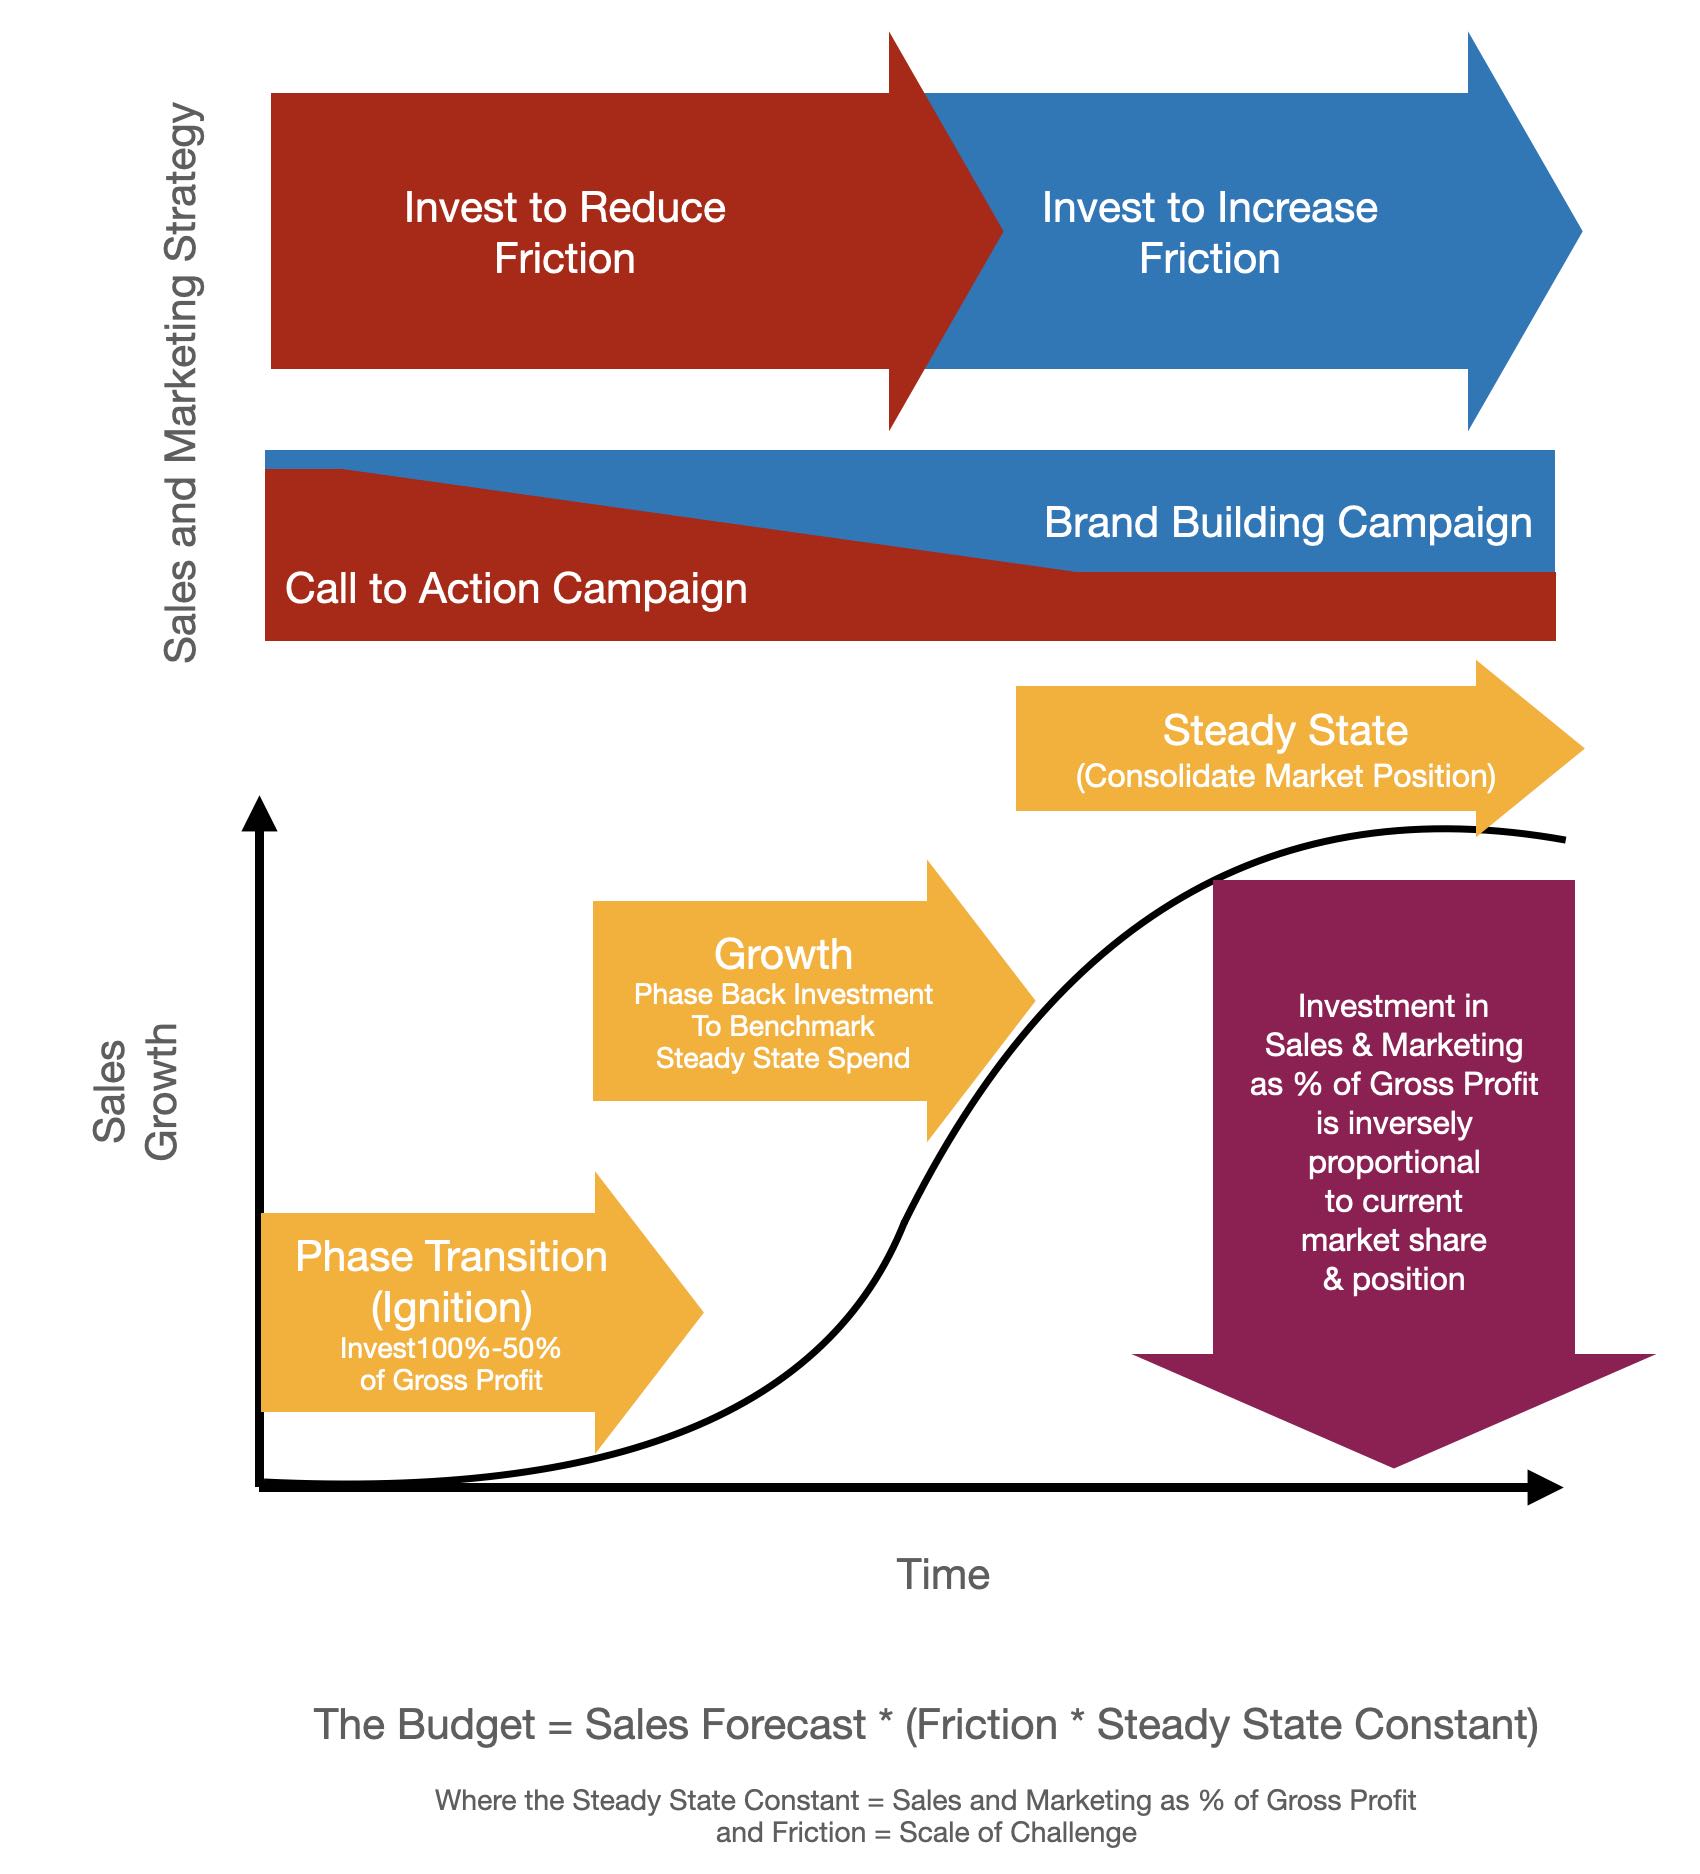
In the first post we explored the idea of marketing being about removing or increasing friction
In this post I want to explore an observation:
In my experience any idiot can count the beans but it takes real genius to build a brand... So why do so many marketing managers waste their days counting beans?
All the indicators are marketing today is fundamentally about portfolio management
You could say it's about managing a portfolio of volatile growth experiments
The good news is the world of investment banking, hedge funds, private equity and venture capital shows us there are a myriad of ways to manage a portfolio to obtain alpha returns
There is everything from the buy and hold strategies of the value investor through to the frenetic algorithmic trading of the day trader
With the 60/40 branding vs performance model of the marketing mix being the equivilent of the mainsteam equities vs bonds 'passive' benchmark
It's just a question of deciding what style suits your investment thesis, doing the research and executing on the model
But more on that idea another day...
The core metric driving marketing spend today is ROI - Return on Investment
and it comes in many forms e.g. ROAS - Return on Advertising Spend being the nano version of this metric promoted by MarTEch vendors, RMI - Return on Marketing Investment
Championed by the managment consulting profession it is a metric imposed by the office of the CFO on the world of marketing
In truth it is an metric Investment Portfolio Managers employ to describe their performance - and again it comes in many forms e.g. MOIC (Multiple on Invested Capital)
Essentially it is the metric for measuring the cash on cash return on the money you invest
The golden rule for maximising your ROI is buy low sell high
But the problem with ROI in the context of Sales and Marketing is simply this
When you buy an ad or pay a salesperson to manage the account you don't actually buy it to sell it to the 'greater fool' sometime in the future
So it is fundamentally the wrong way of thinking about why you have bought the ad in the first place
It also introduces unnecessary volatility into the growth model (but more on that later)
Employing ROI as a KPI totally bypasses the most obvious question: Does spending more on sales and marketing = more growth? (and Vice Versa)
As you can see in the charts below the answer is generally yes
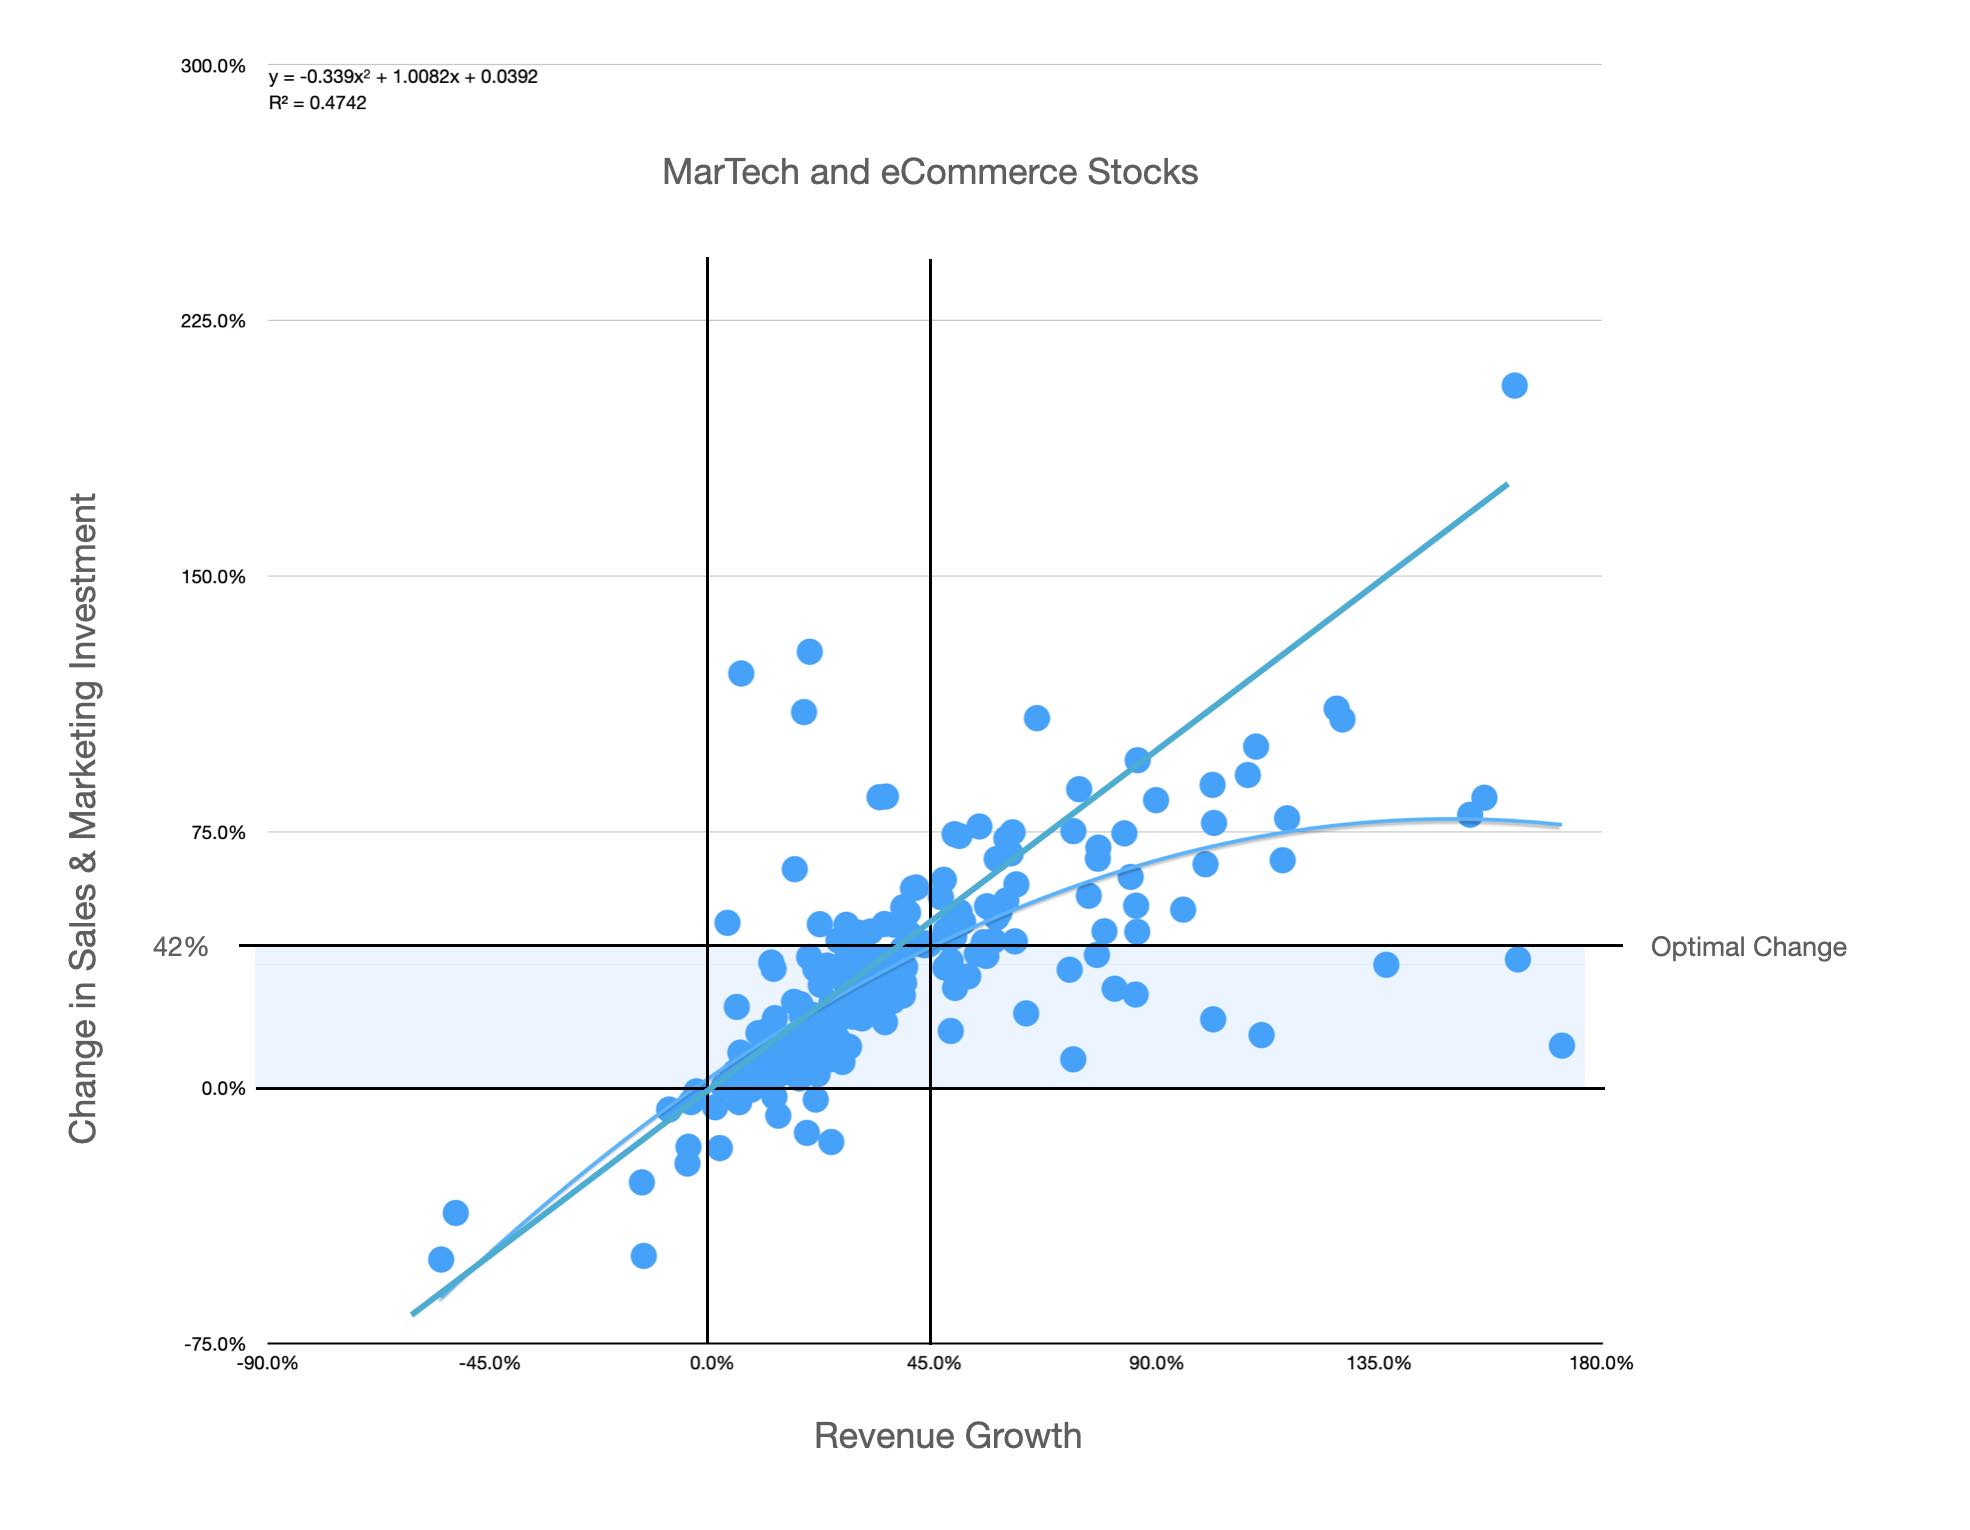
and the same applies to established consumer brands
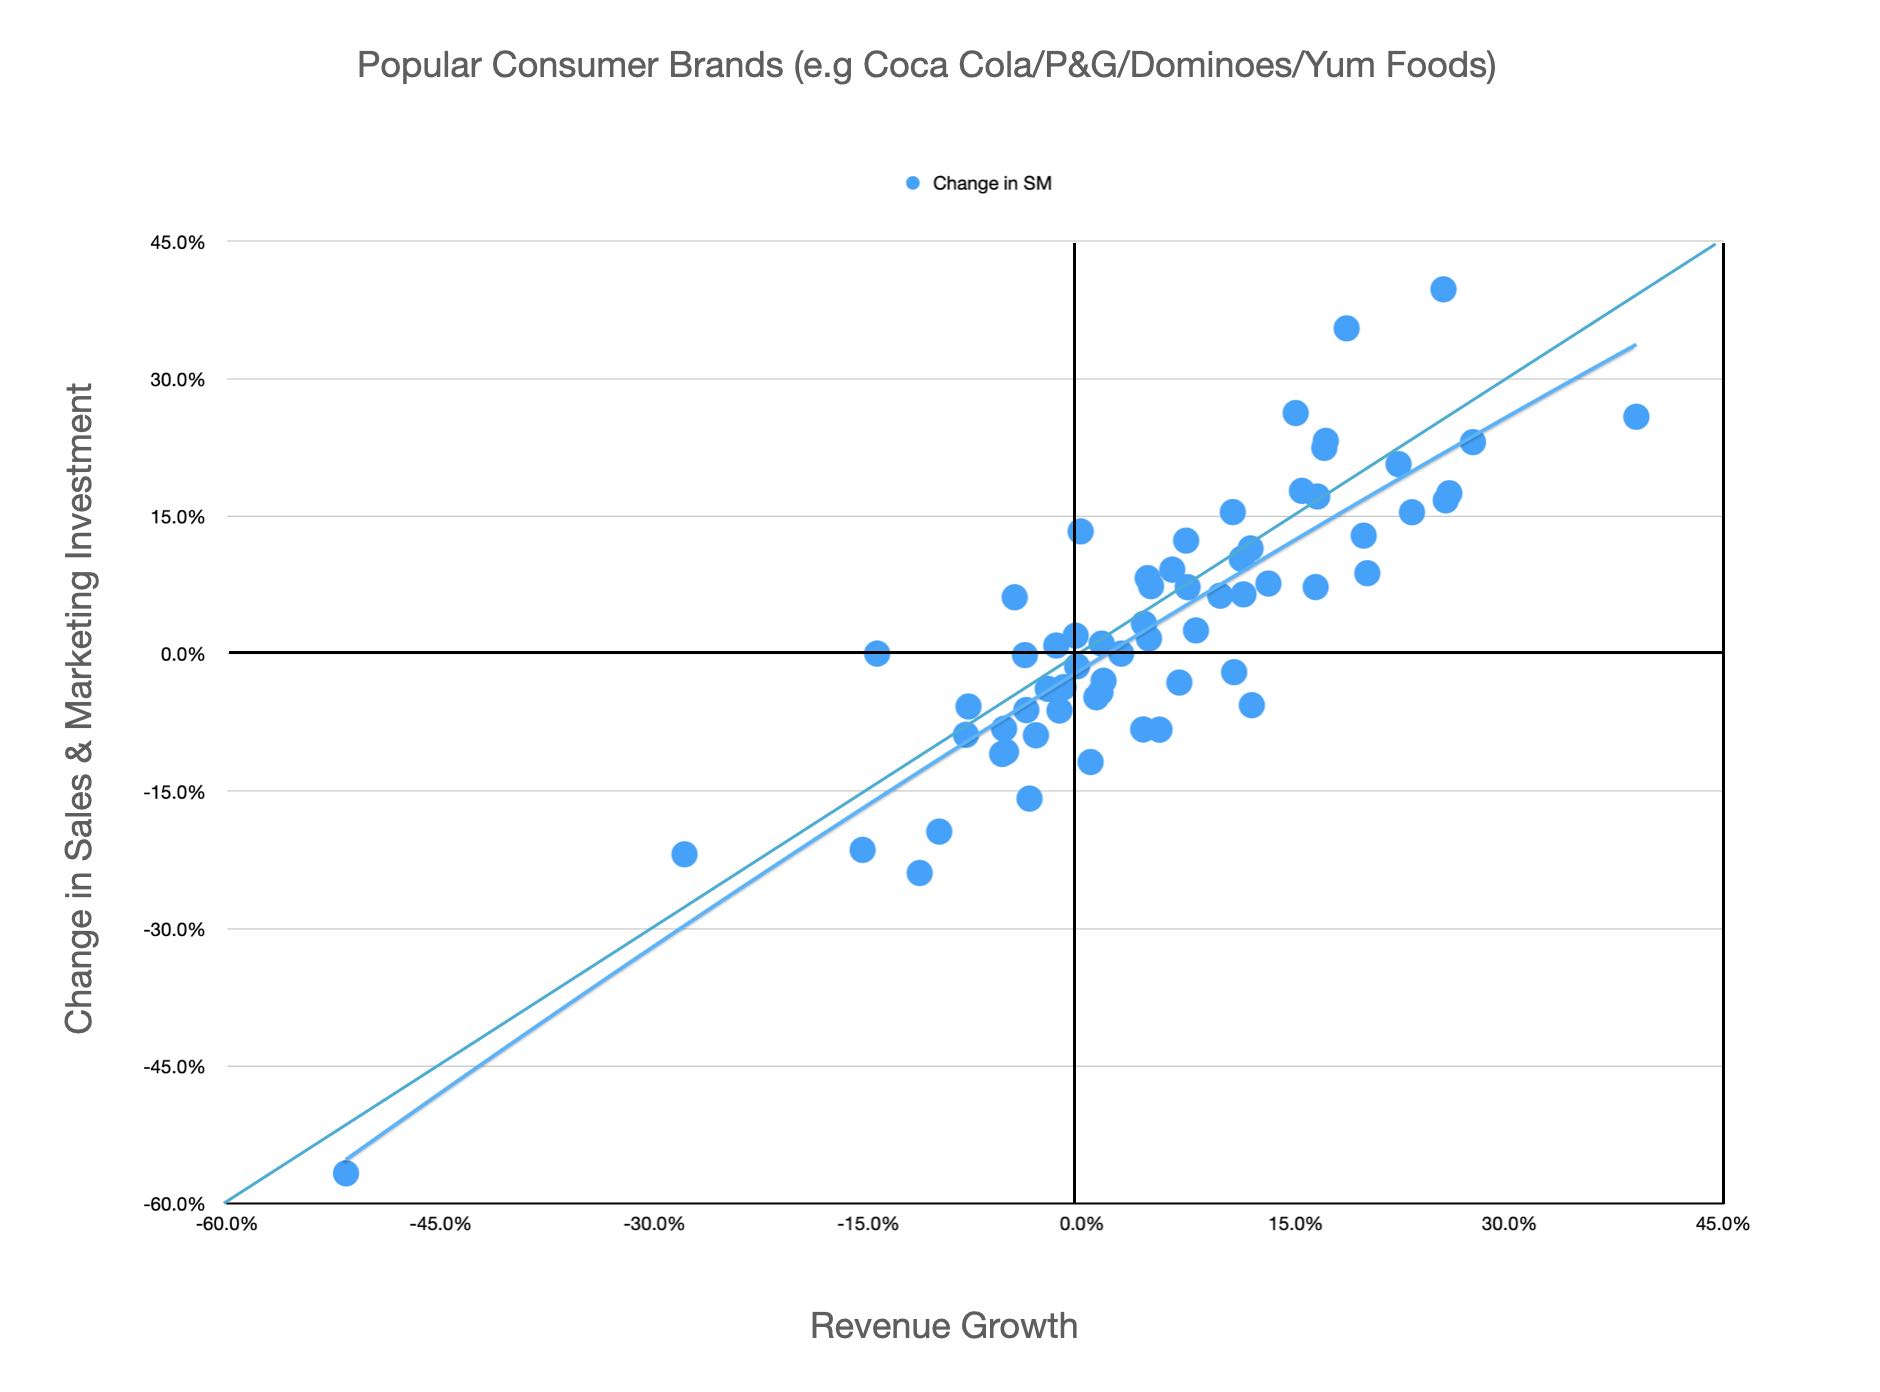
Spend more = grow more... Spend less = grow less
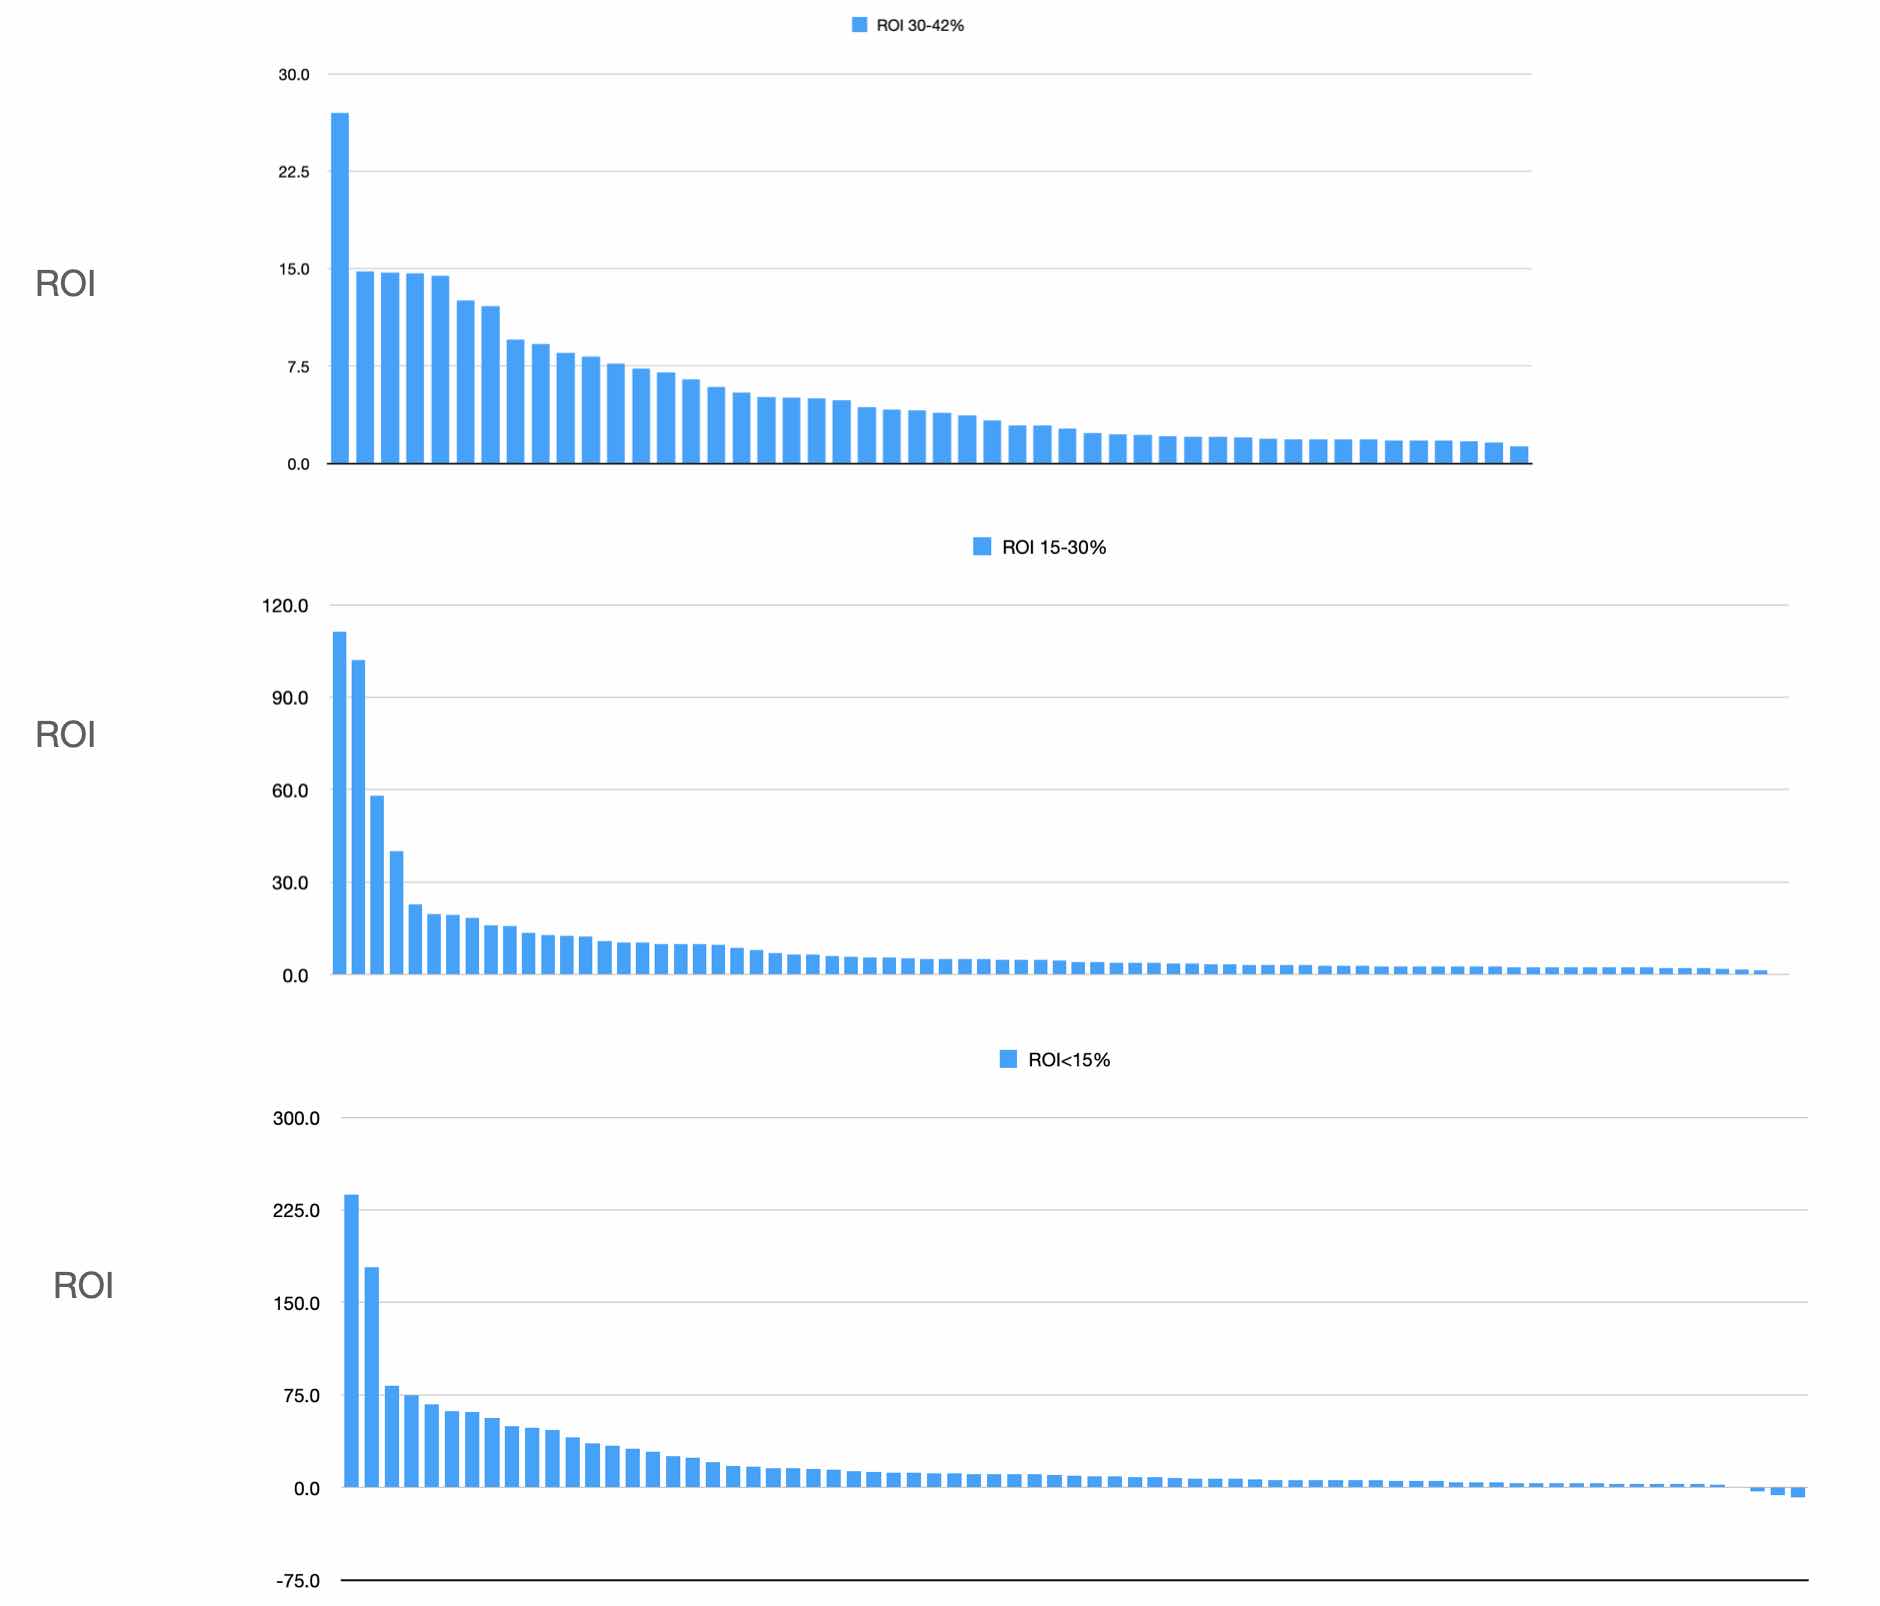
Now let's take a look at the ROI spread on this dataset
These 3 charts dissect the spread into 3 distinct layers of ROI based on the change in Sales and Marketing Investment (Year on Year)
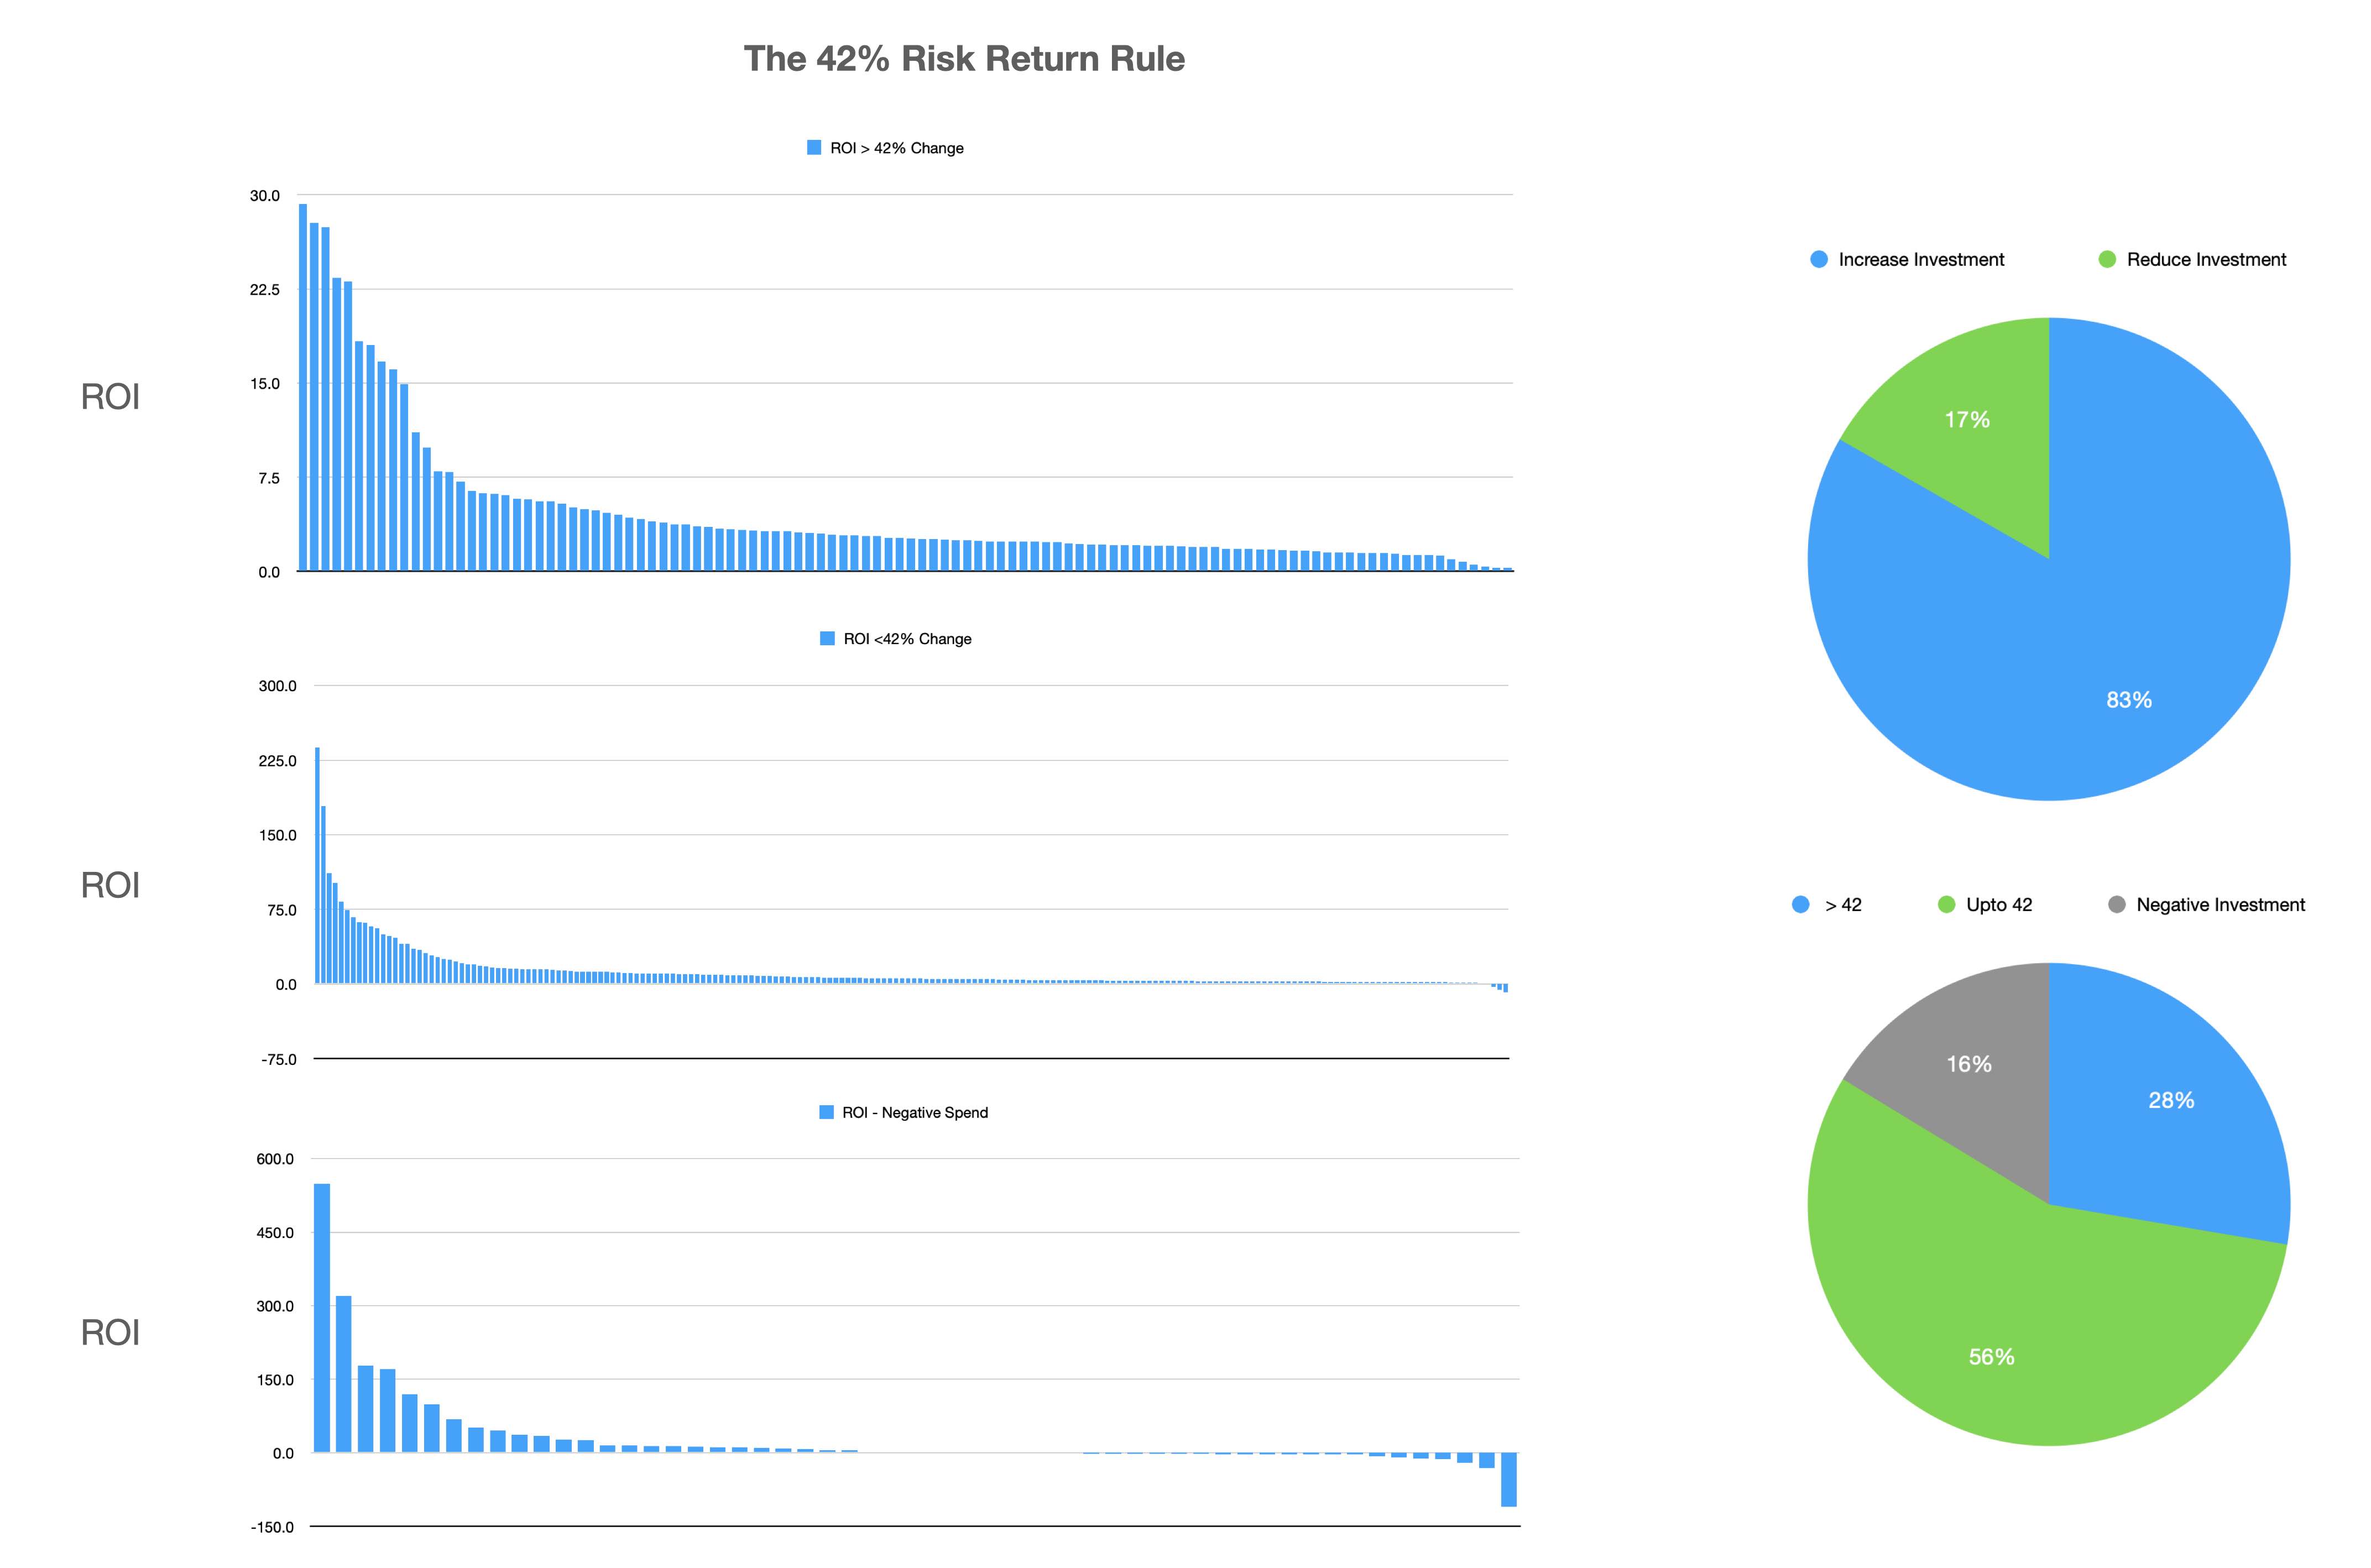
As you can see. As the spend decreases and trends towards negative the ROI becomes more volatile
The ROI numbers become increasing elastic - delivering bigger gains and bigger losses
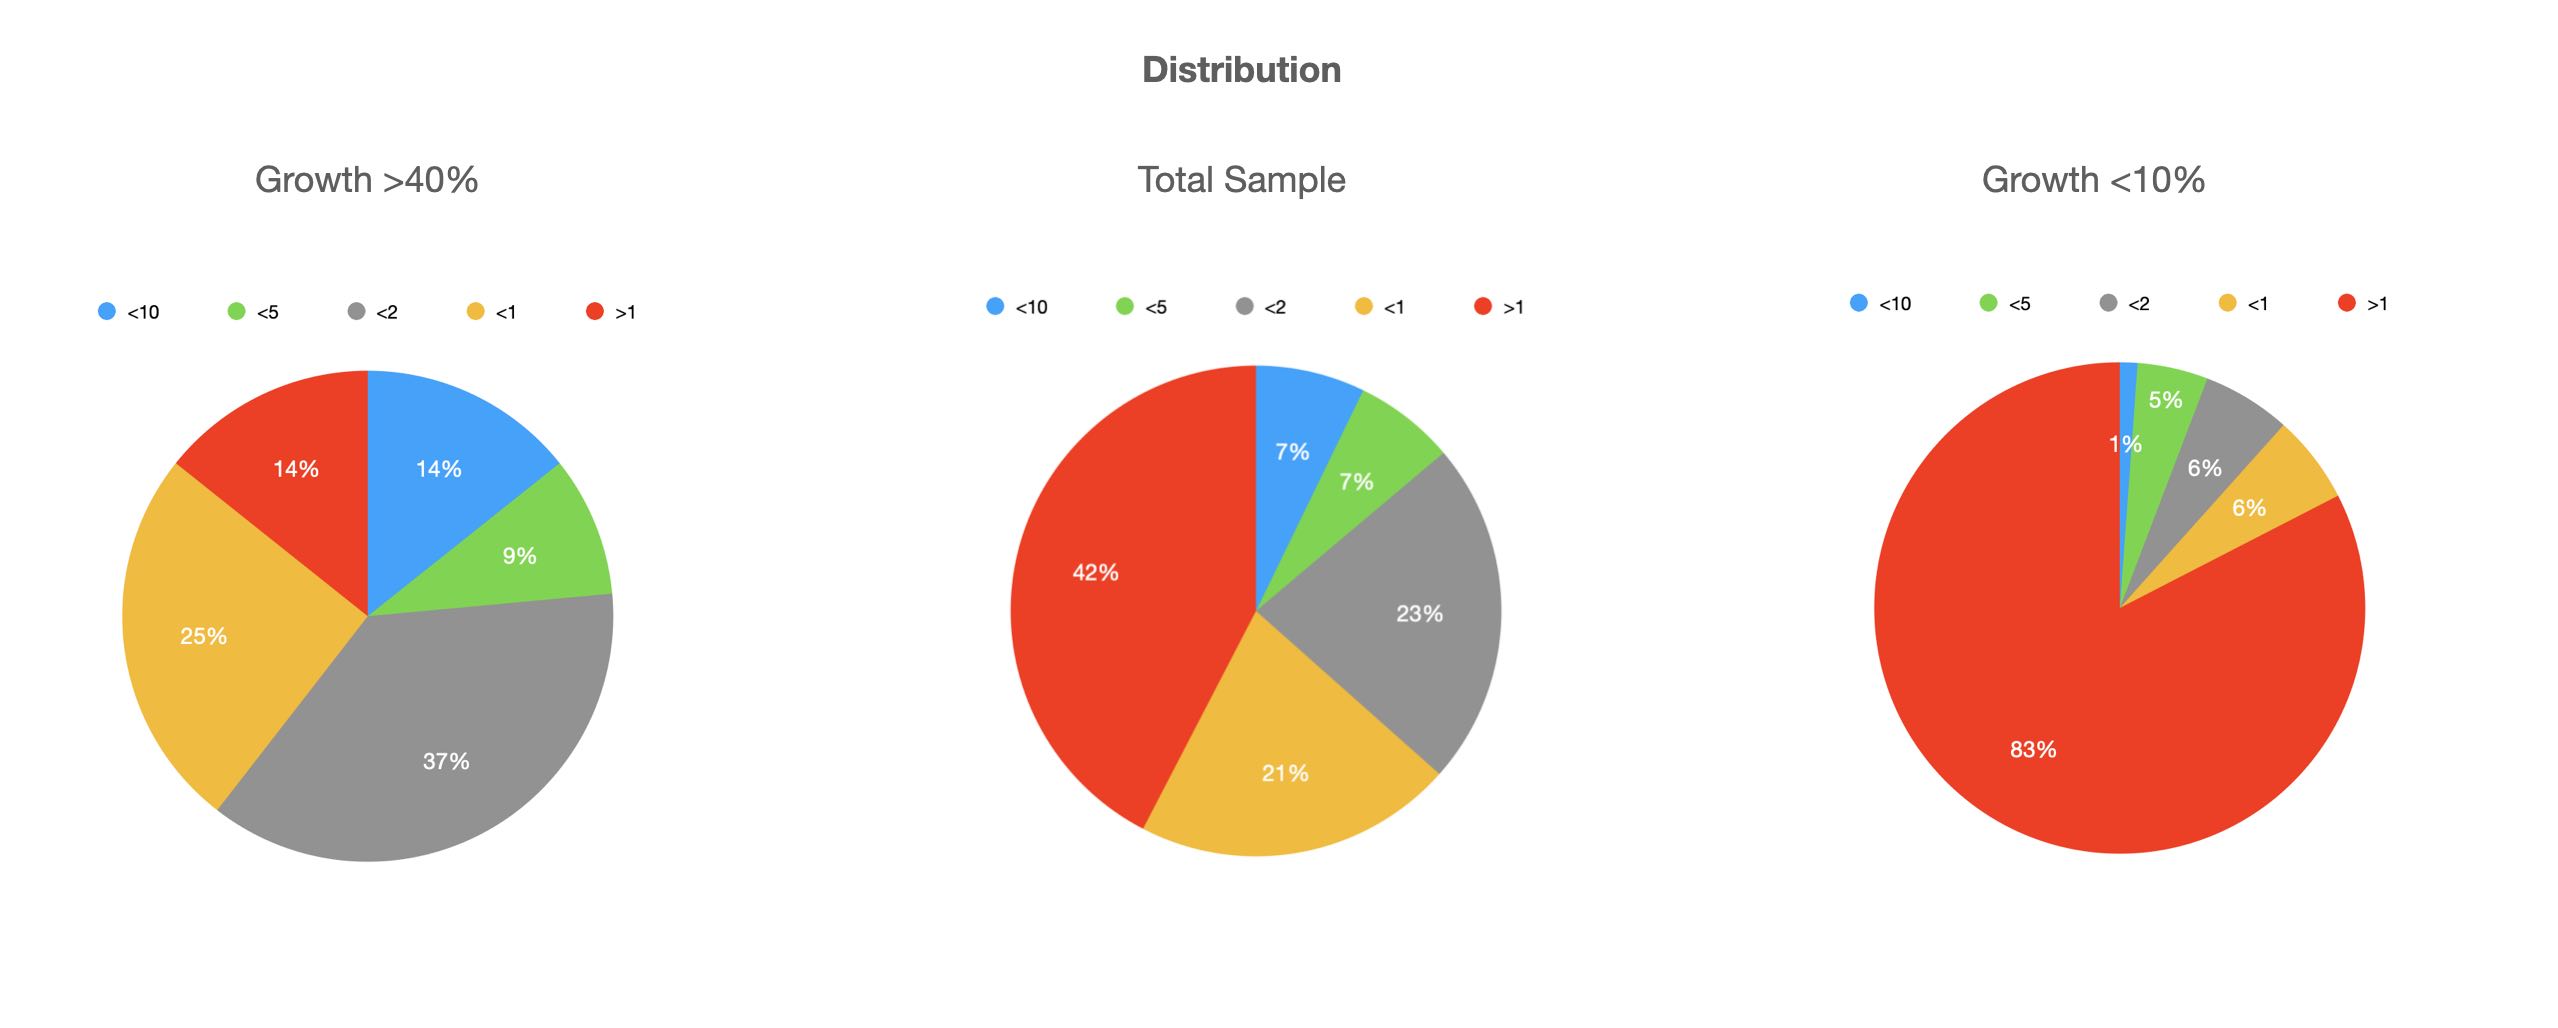
Breakdown the sample further and you'll discover the sweet spot in the equation appears to be a 15%-30% increase in Sales and Marketing
Understand this and you are now aware of the limitations of ROI as a target metric for forecasting revenue growth
Any discussion about ROI should be framed within the context of implied volatility of adopting the target based on the change in Sales and Market investment
and this raises the question: Is there a better target management metric than ROI?
Well let's try this idea...
What happens when we revalue the ROI target to accomodate the primary function of the investment (in sales & marketing) ie. growth
The new formula being ROGI(x)=ROI(x)*Revenue Growth(%)
Well we discover this...
and, assuming our benchmark target to be 1x, we discover that an investment in Growth outperforms the average on an adjusted basis
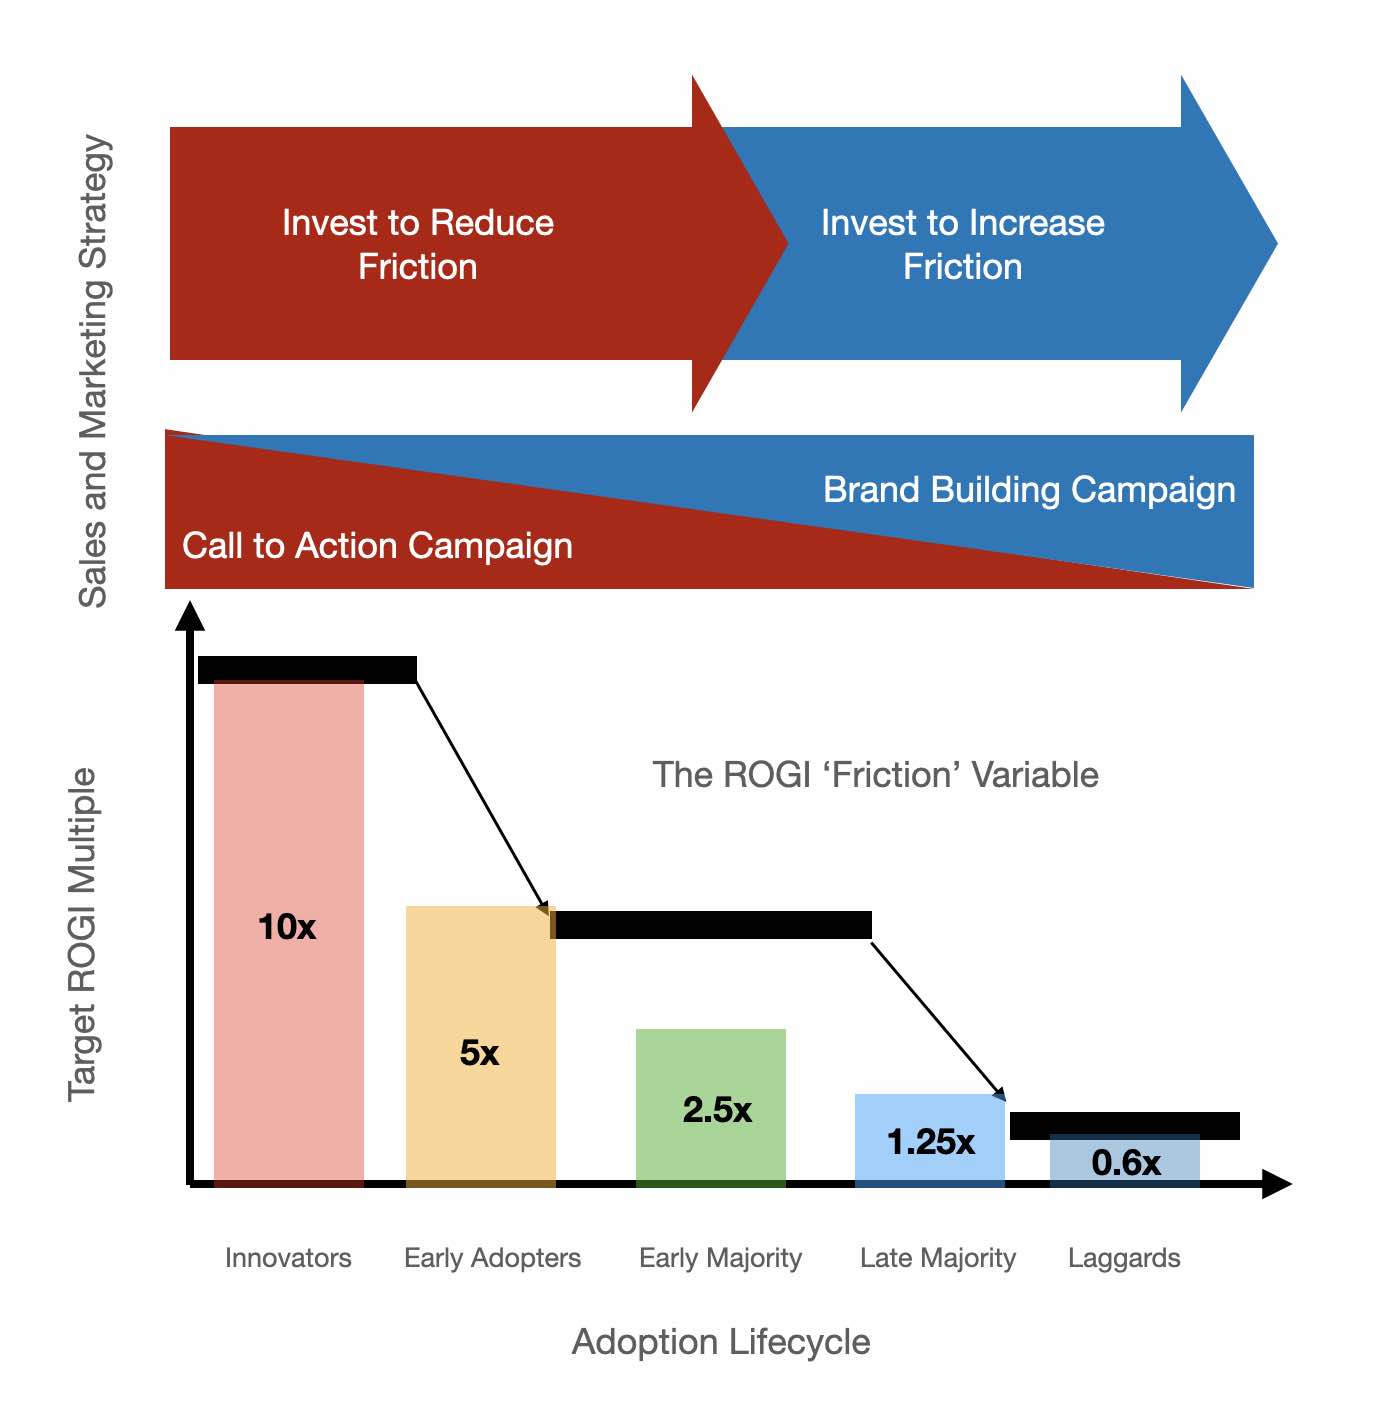
and this in turn suggests the ROGI benchmark should reflect the relative position of the business or product within the business or product lifecycle
Which in turn provides us with some viibility of the investment required to overcome market friction/inertia
Can we validate this idea?
Well let's see what happens when we map four of the Dot Com winners against the model
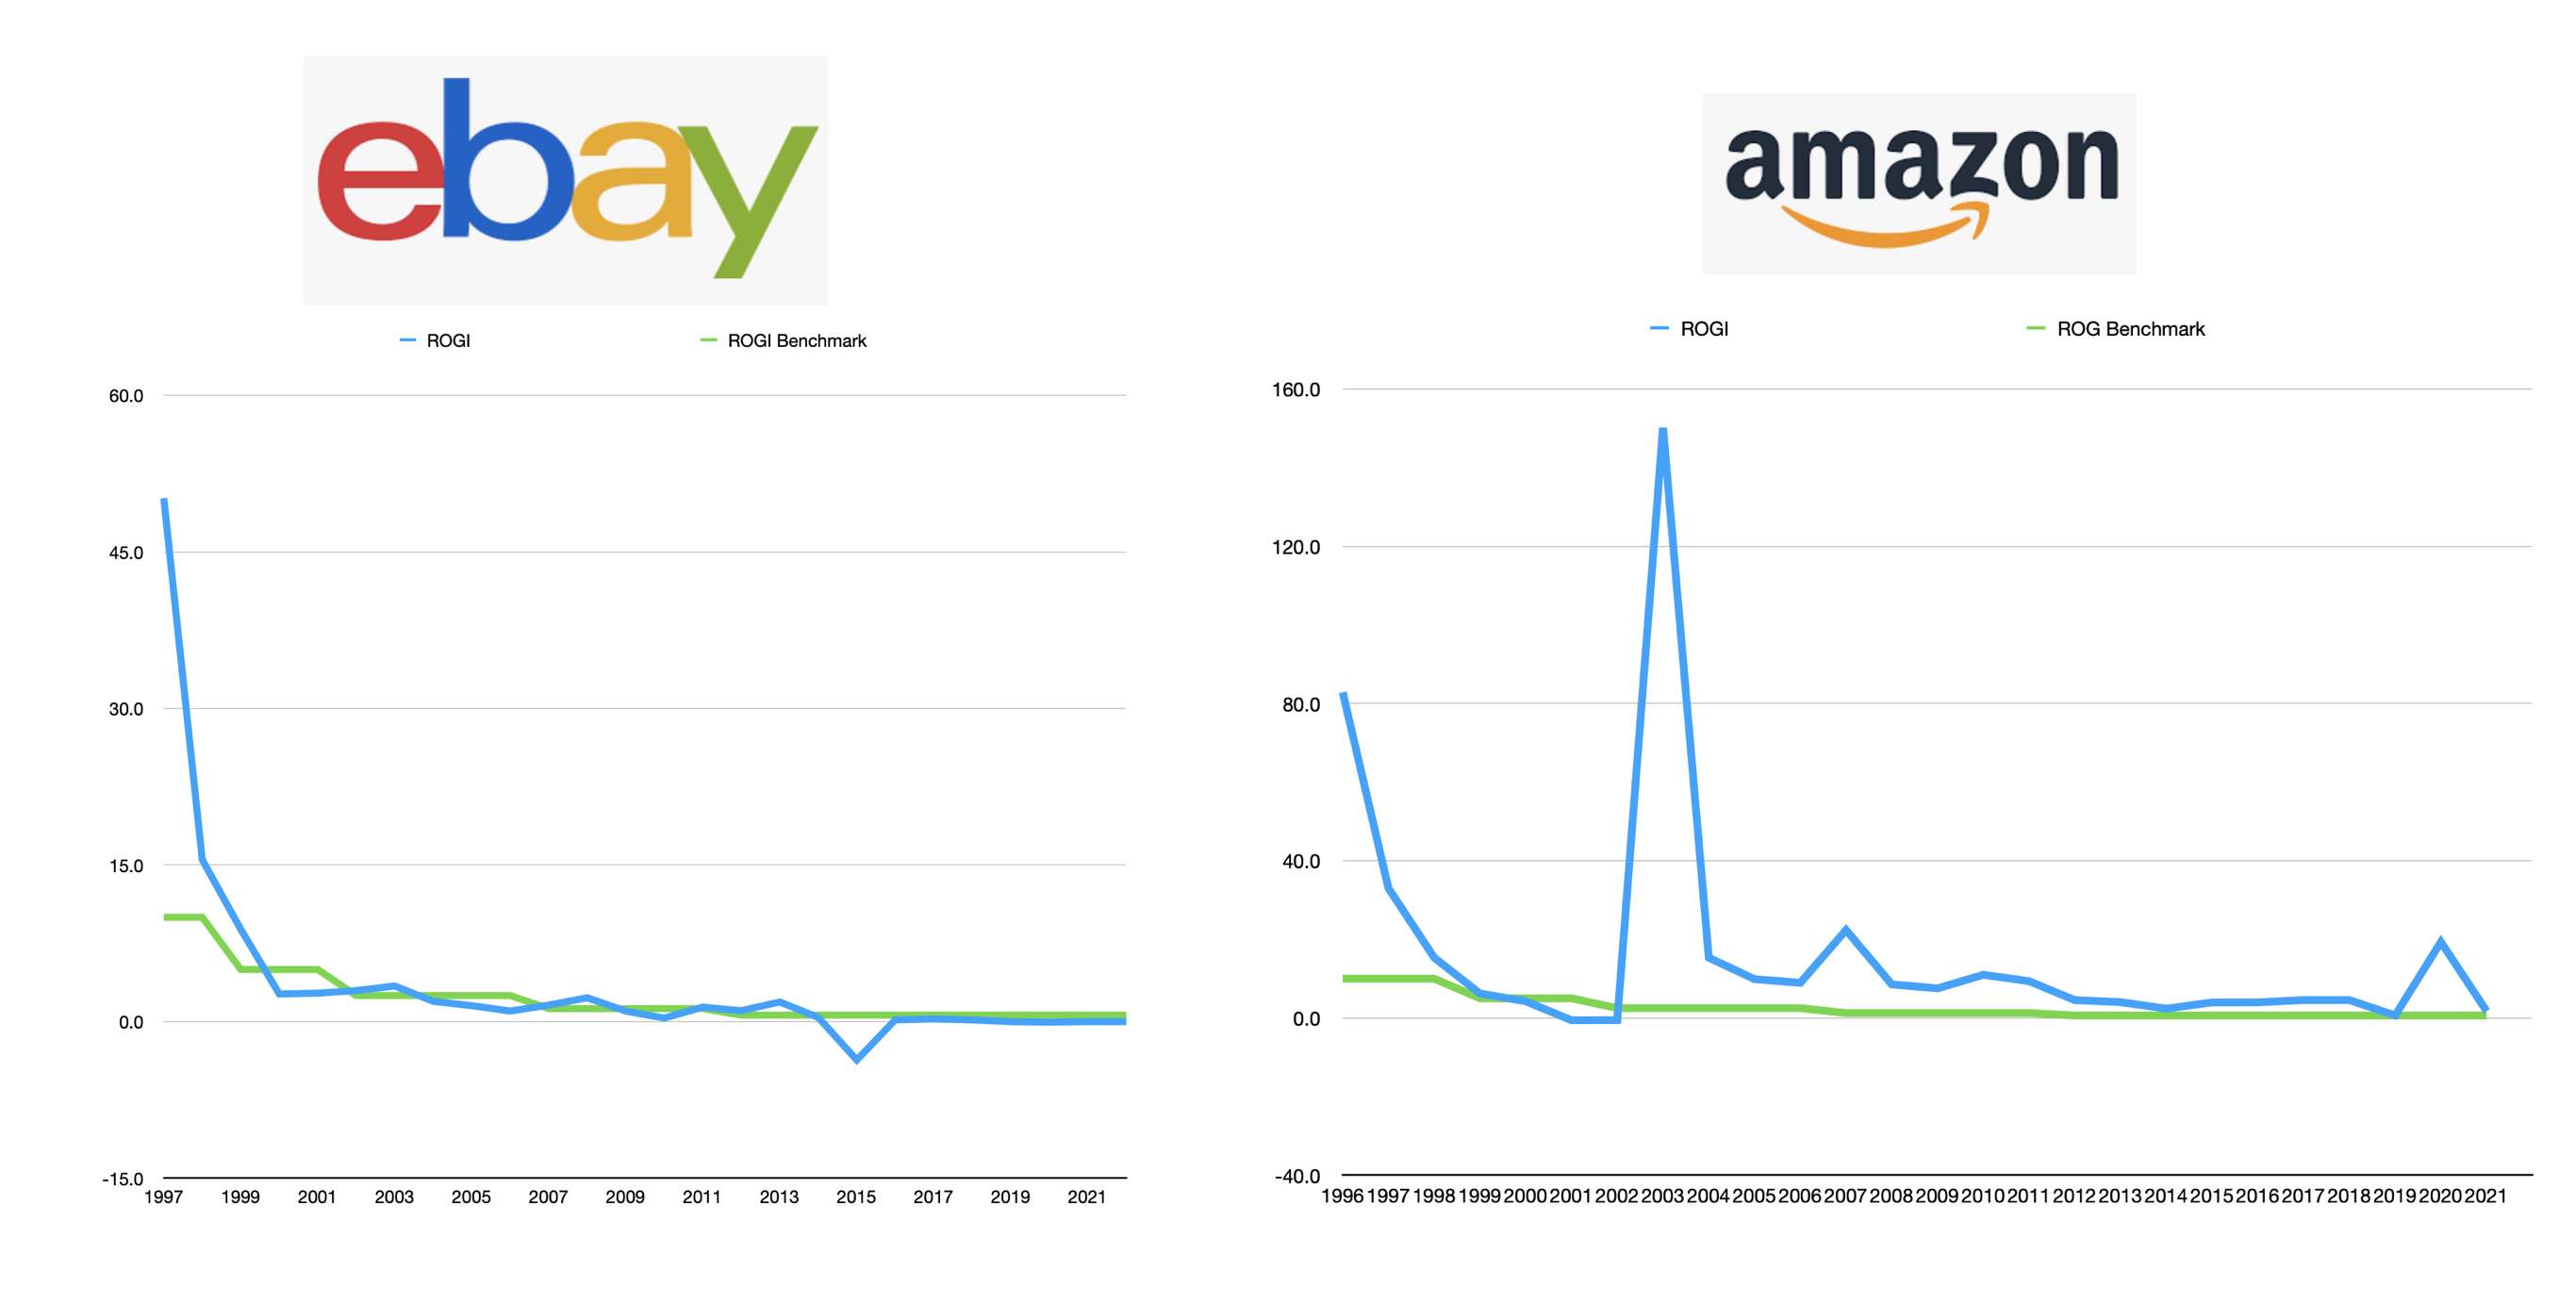
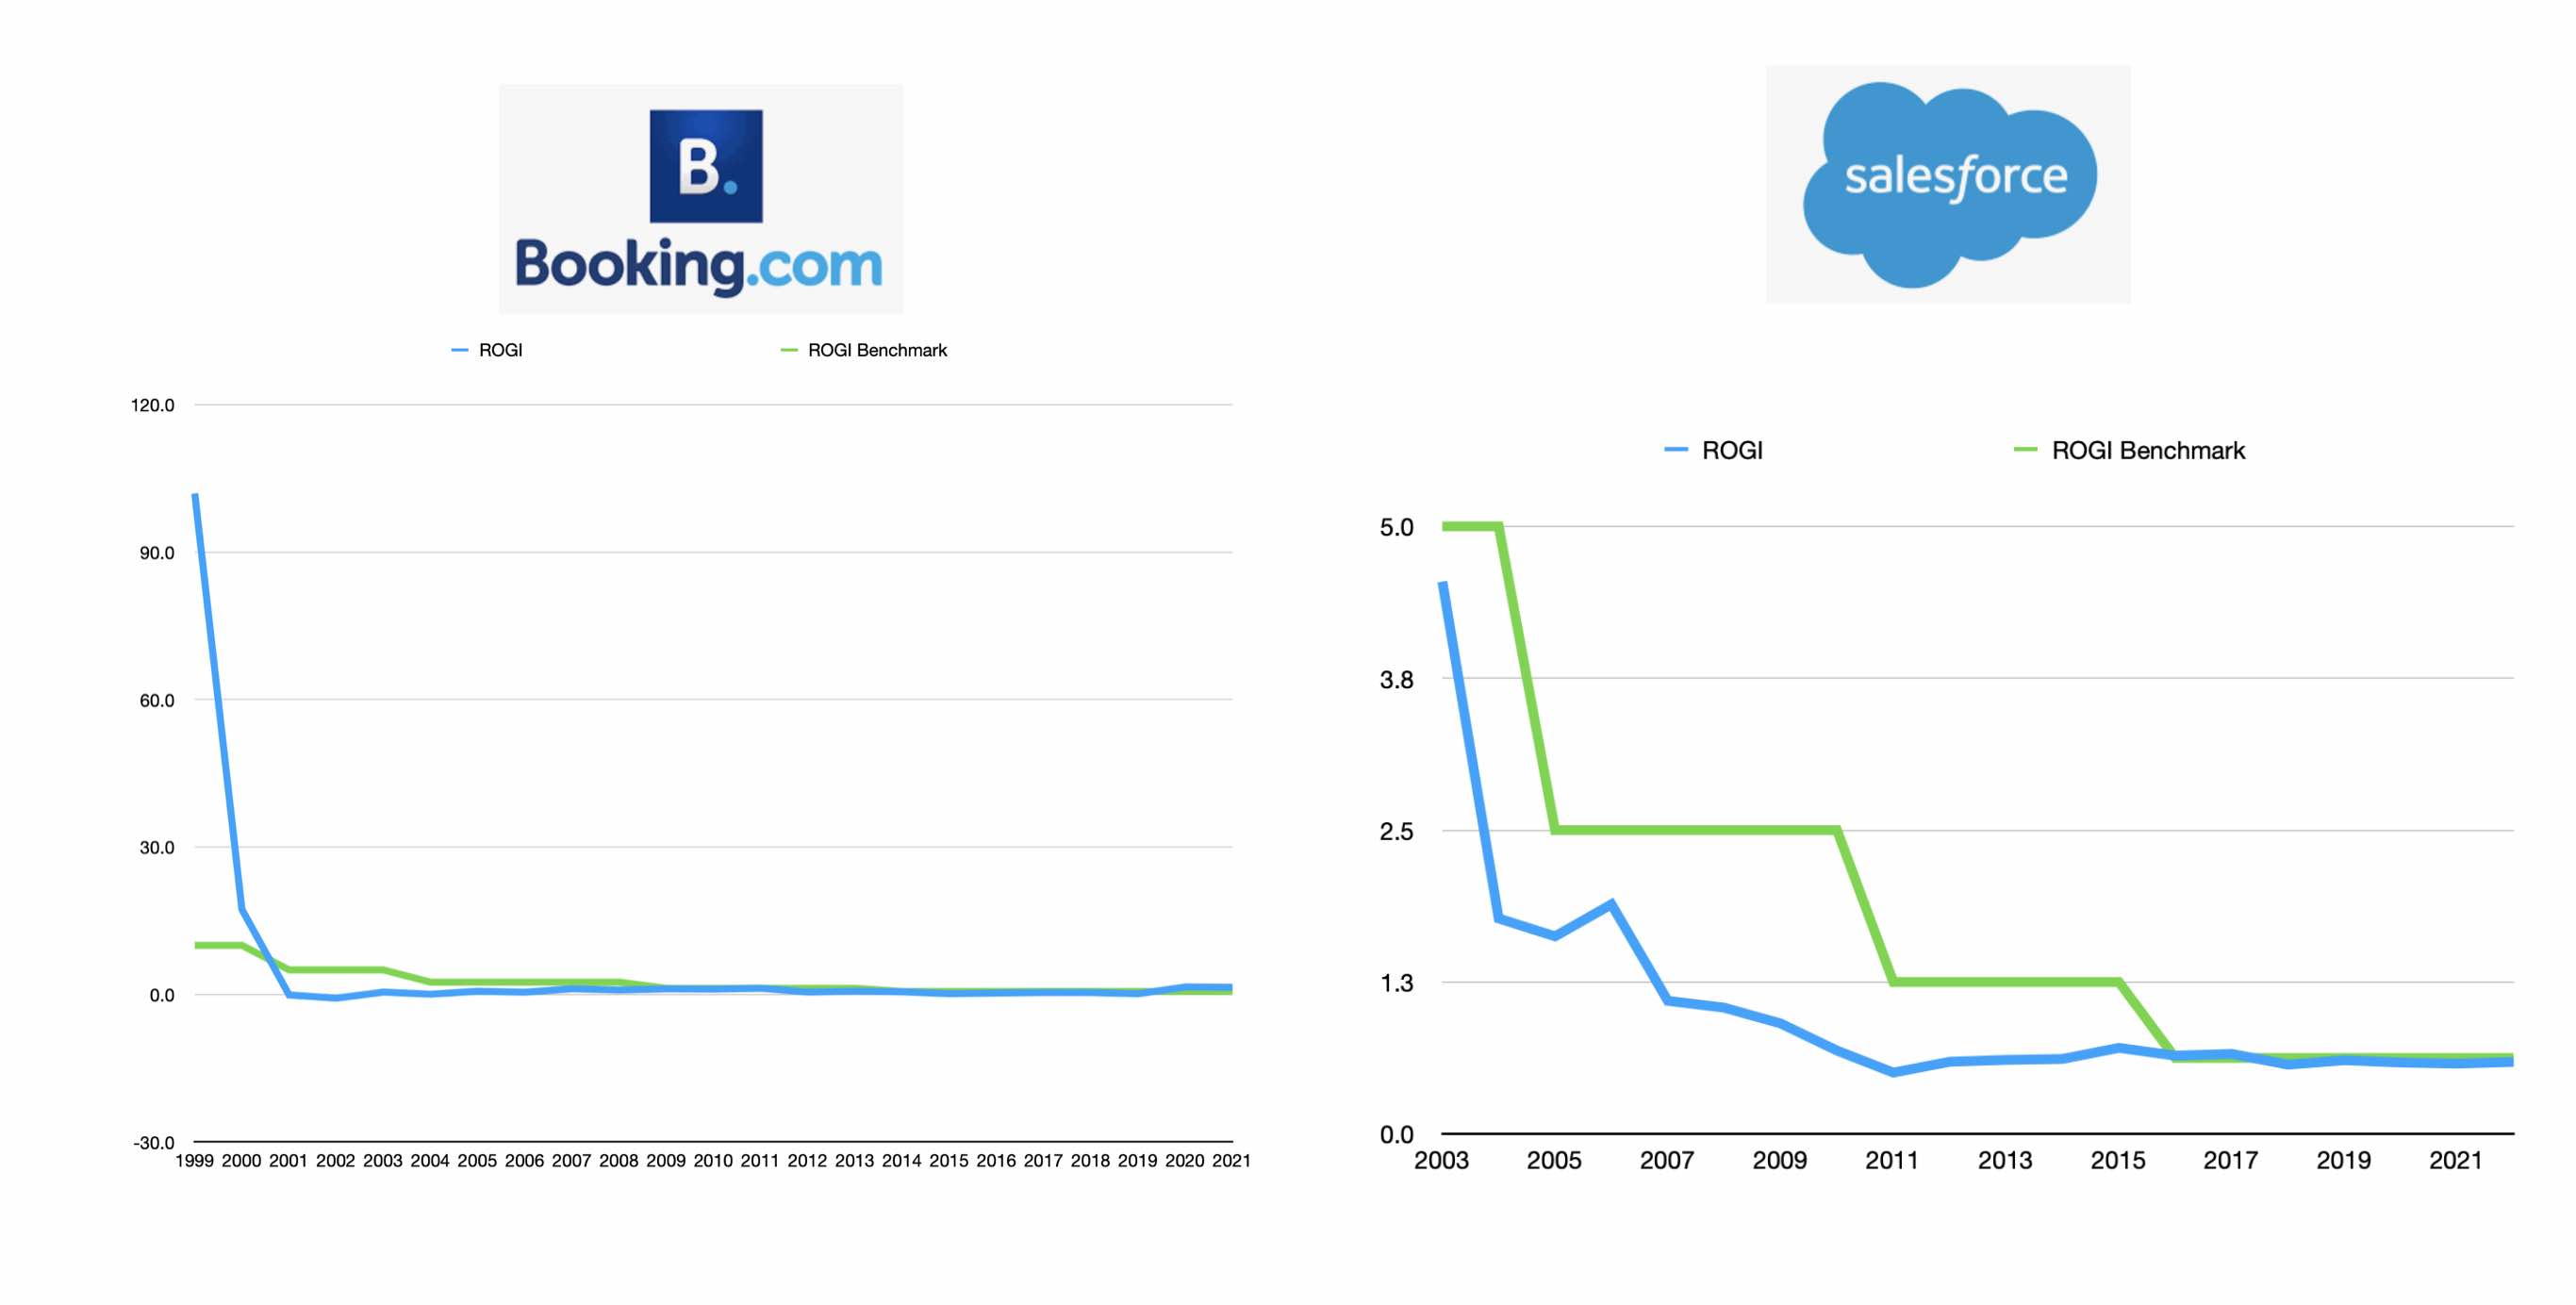
We discover - bar the seismic shifts created by the DotCom Crash, the GFC and now the Everything Bubble - the model holds up pretty well
We also see pretty quickly how much more efficient Amazon has been over the years compared to eBay, Booking.com and Salesforce
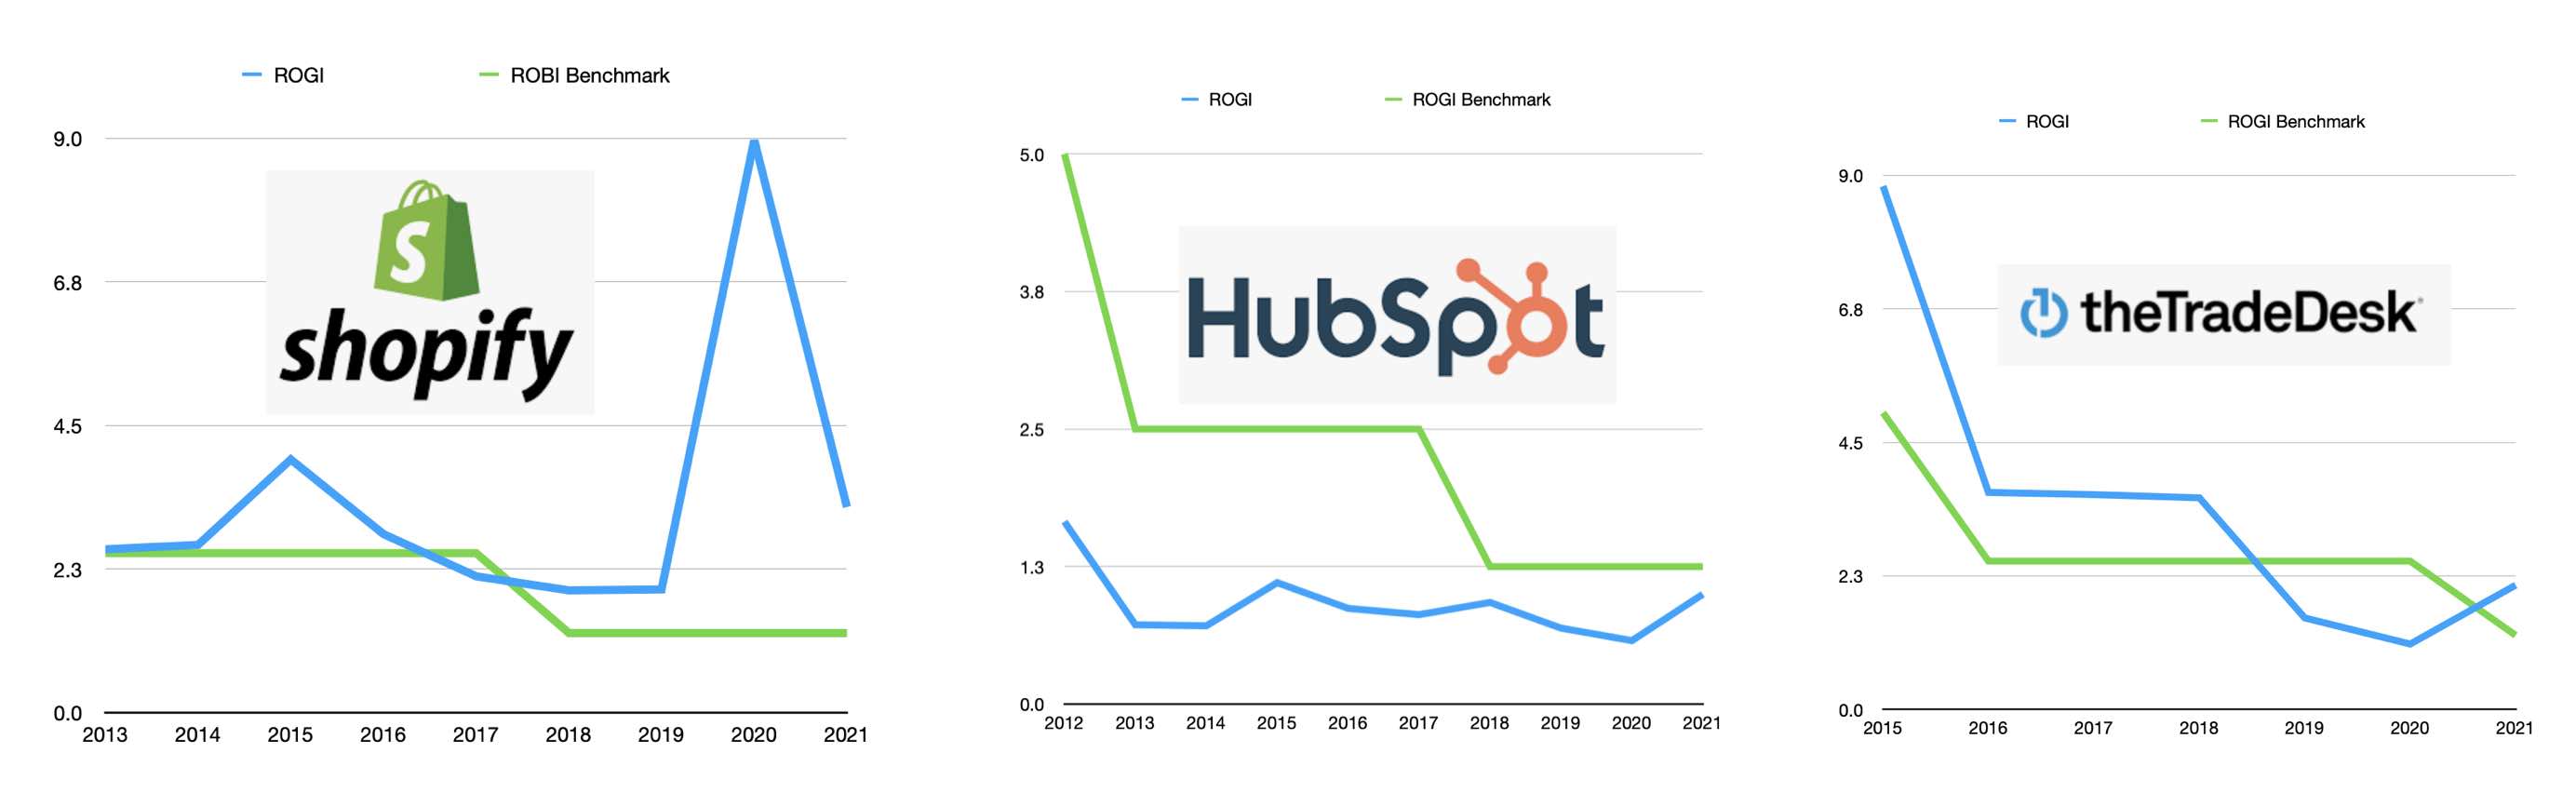
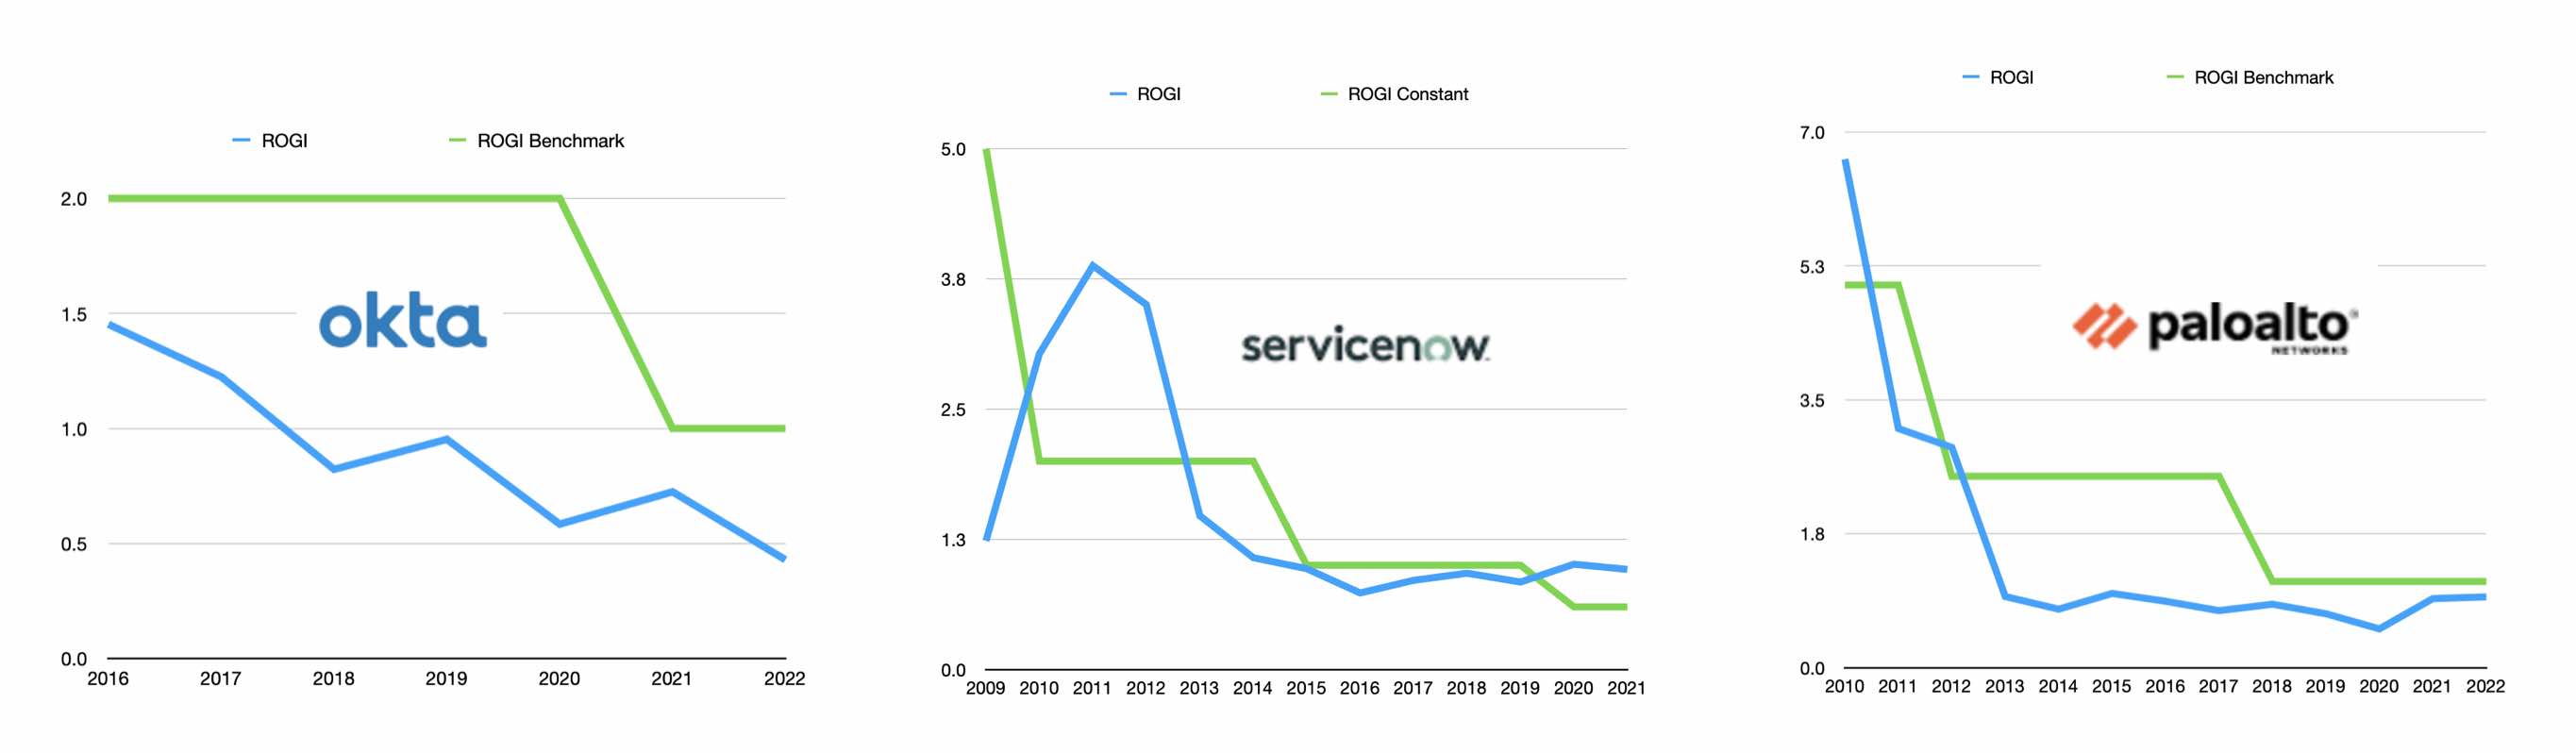
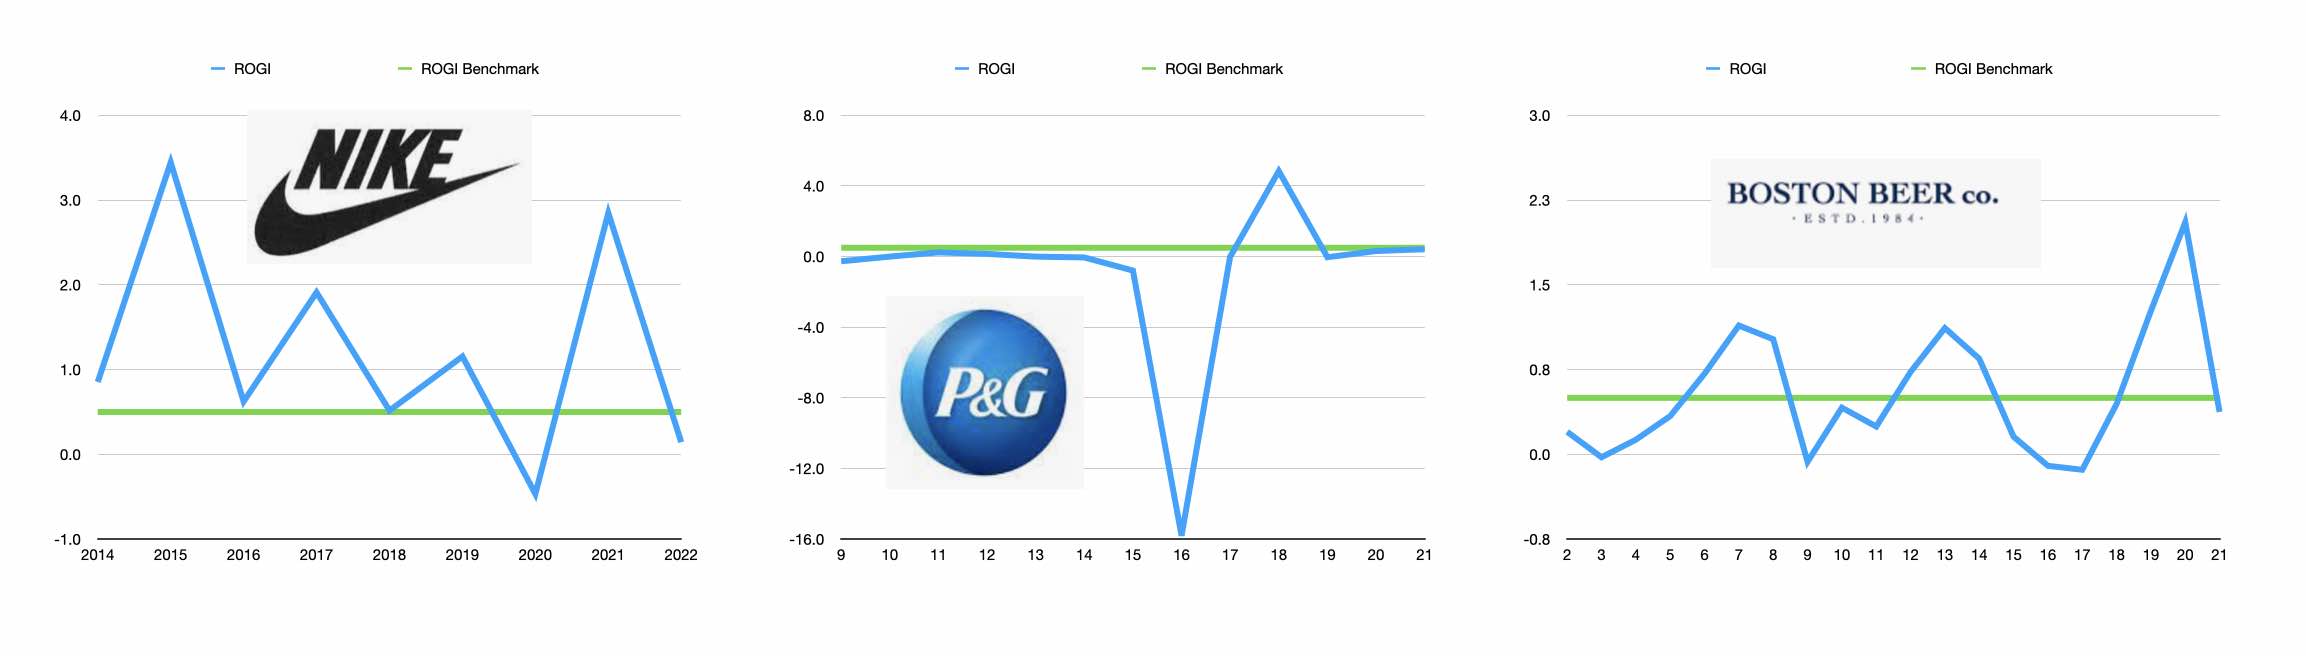
Moving on we can also see how the model stands up by comparing the relative performance of this current generation of SaaS players
...some of the eCommerce plays
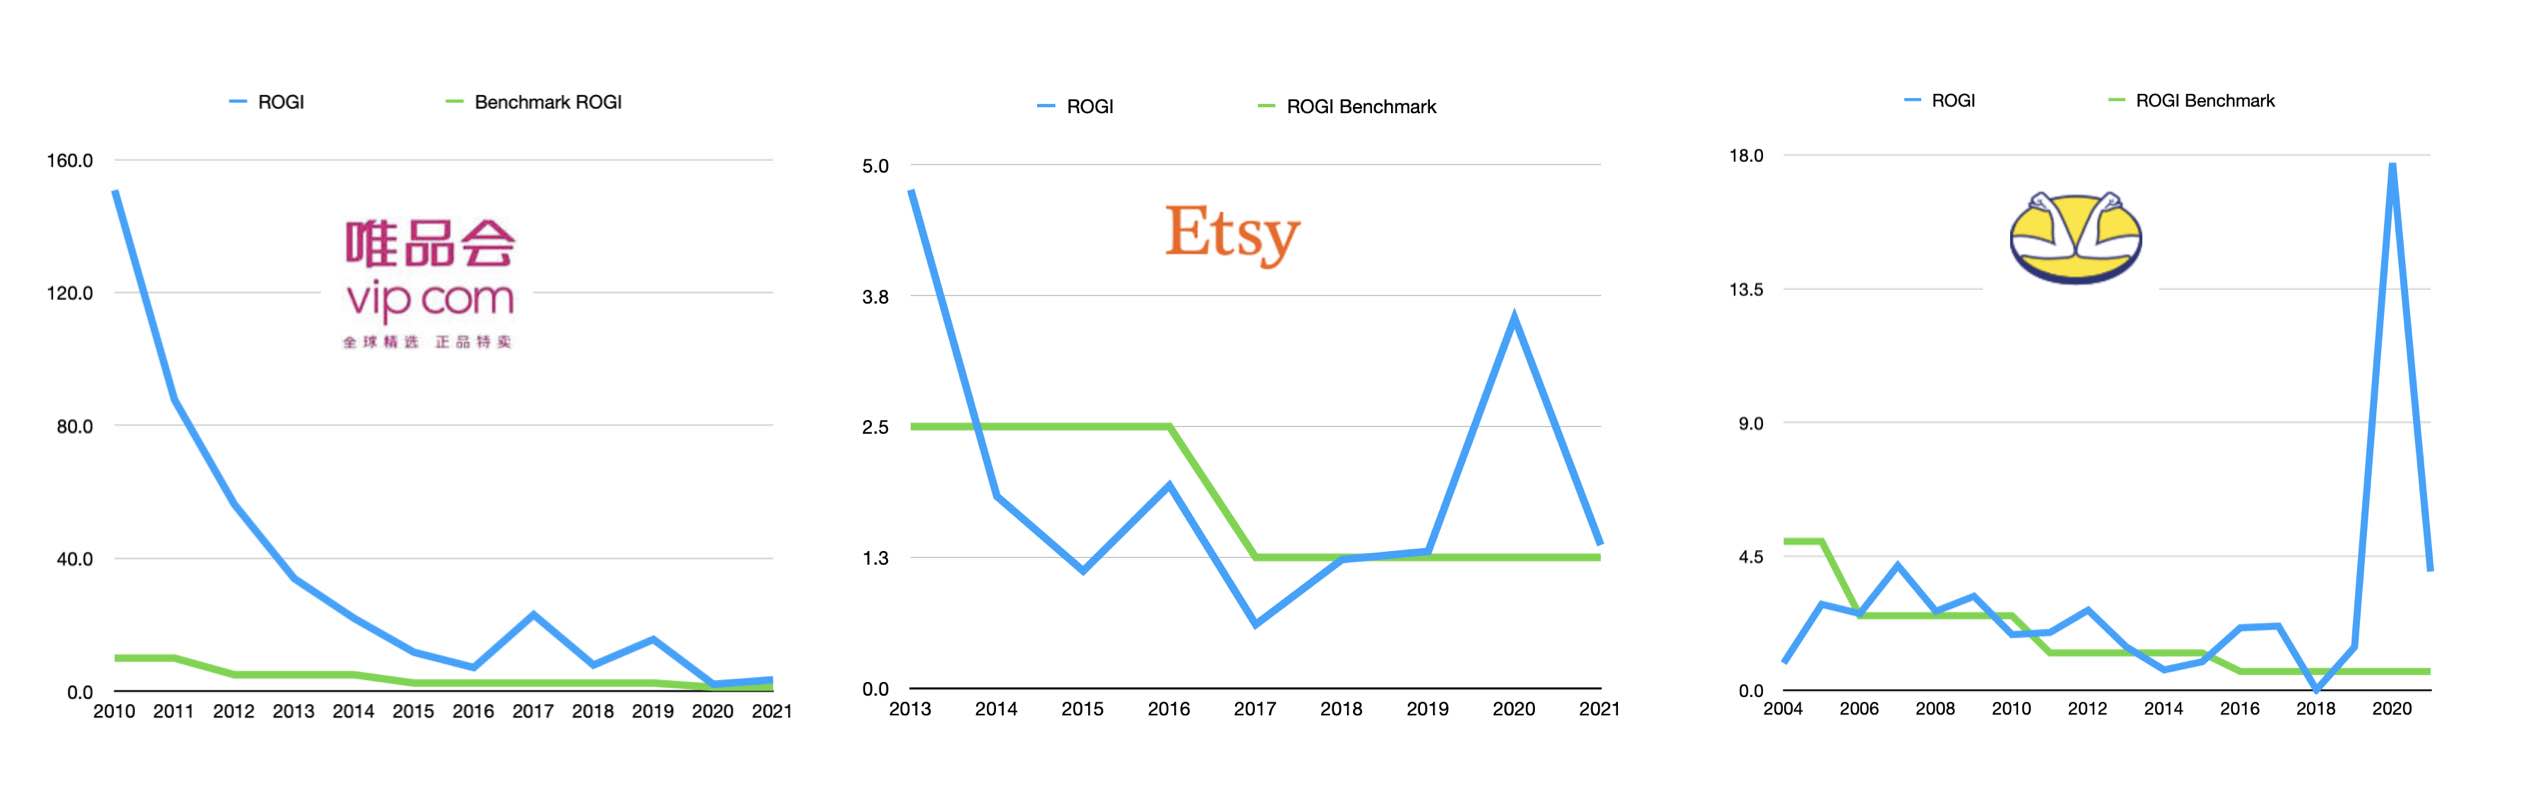
and finally a sample of 'late stage' consumer brands
Is it useful? I'll leave that up to you to decide
But at the very least it points us towards what the 'steady state constant' may well be in the Phase Changers equation
Note: Parts 1, 3, 4 & 5 can be found here, here, here and here
The ROGI Model
Originally Published Spring 2022
This is the first draft of the ROGI Model
It is basically a tool for exploring the pro's and con's of the ROI and ROGI metrics as a measure for identifying the strategic fit of a sales and marketing plan
Product Cycle
Target Market
Performance
Campaign Objectives
Current Year
Revenue
$
Sales and Market Costs
$
Next Year
Growth Forecast
%
Budget Forecast
Revenue Forecast
$
Revenue Increase
$
Sales and Marketing Budget
$
Sales Budget
$
Marketing Budget
$
Performance Marketing Budget
$
Brand Building Budget
$
KPIs Forecast
ROI (x)
ROGI (x)
Disclaimer
The use of these calculators, charts, visualisations, data or any information shall be at the user’s sole risk. Such use shall constitute a release and agreement to hold harmless, defend and indemnify Digital Partners from and against any liability (including but not limited to liability for special, indirect or consequential damages) in connection with such use. Such release from and indemnification against liability shall apply in contract, tort (including negligence of such party, whether active, passive, joint or concurrent), strict liability, or other theory of legal liability; provided, however, such release, limitation and indemnity provisions shall be effective to, and only to, the maximum extent, scope or amount allowable by law.
Questions of accuracy
Tymbals is an experiment in machine learning and statistical modelling of small data pools. Tymbals is still under development. It is still learning. Tymbals is Beta - i.e. Pre-release.
The probabilities and outputs (e.g. calculators, charts, visualisations) will evolve and change as the system ingests more data.
Tymbals is a probability model. The results generated by Tymbals are market estimates based on the cummulative value of the data within the distributed data pools.
Privacy
All data inputs are automatically added to the learning pool from which Tymbals models are generated.
If you do not want your data added the data pool do not use Tymbals