A random walk into the land of venture capital

Last year Accenture invited us to spend autumn in Hong Kong with the innovation teams at BNP Paribas, Bank of America Merrill Lynch, Commonwealth Bank of Australia, Credit Suisse, Goldman Sachs, HSBC, J.P. Morgan, Macquarie Group, Morgan Stanley, Nomura and Sun Life Financial. The focus was on defining the market fit of our "distributed ledger of probabilities" forecasting technology within the Financial Services & Insurance Sectors.


We decided to utilise our time there to build a Robo-VC model.


Our thinking was: It is seven years since Marc Andreessen proclaimed in the WSJ: "Software is eating the world".


Today Venture Capital is a $0.5 Trillion Global 'Cottage Industry'. Raking in over $10 Billion in administration fees


...and yet less than 5% of VC's utilise in-house data analytics at scale.


So we decided to investigate the question: Can software eat venture capital?


Just how hard would it be to build an Artificial Intelligent Venture Capitalist (Think: RoboVC) that could not only compete with the market... but beat the market?


We began the journey by looking for patterns of divergence, convergence, emergence and contagion in the publicised industry data


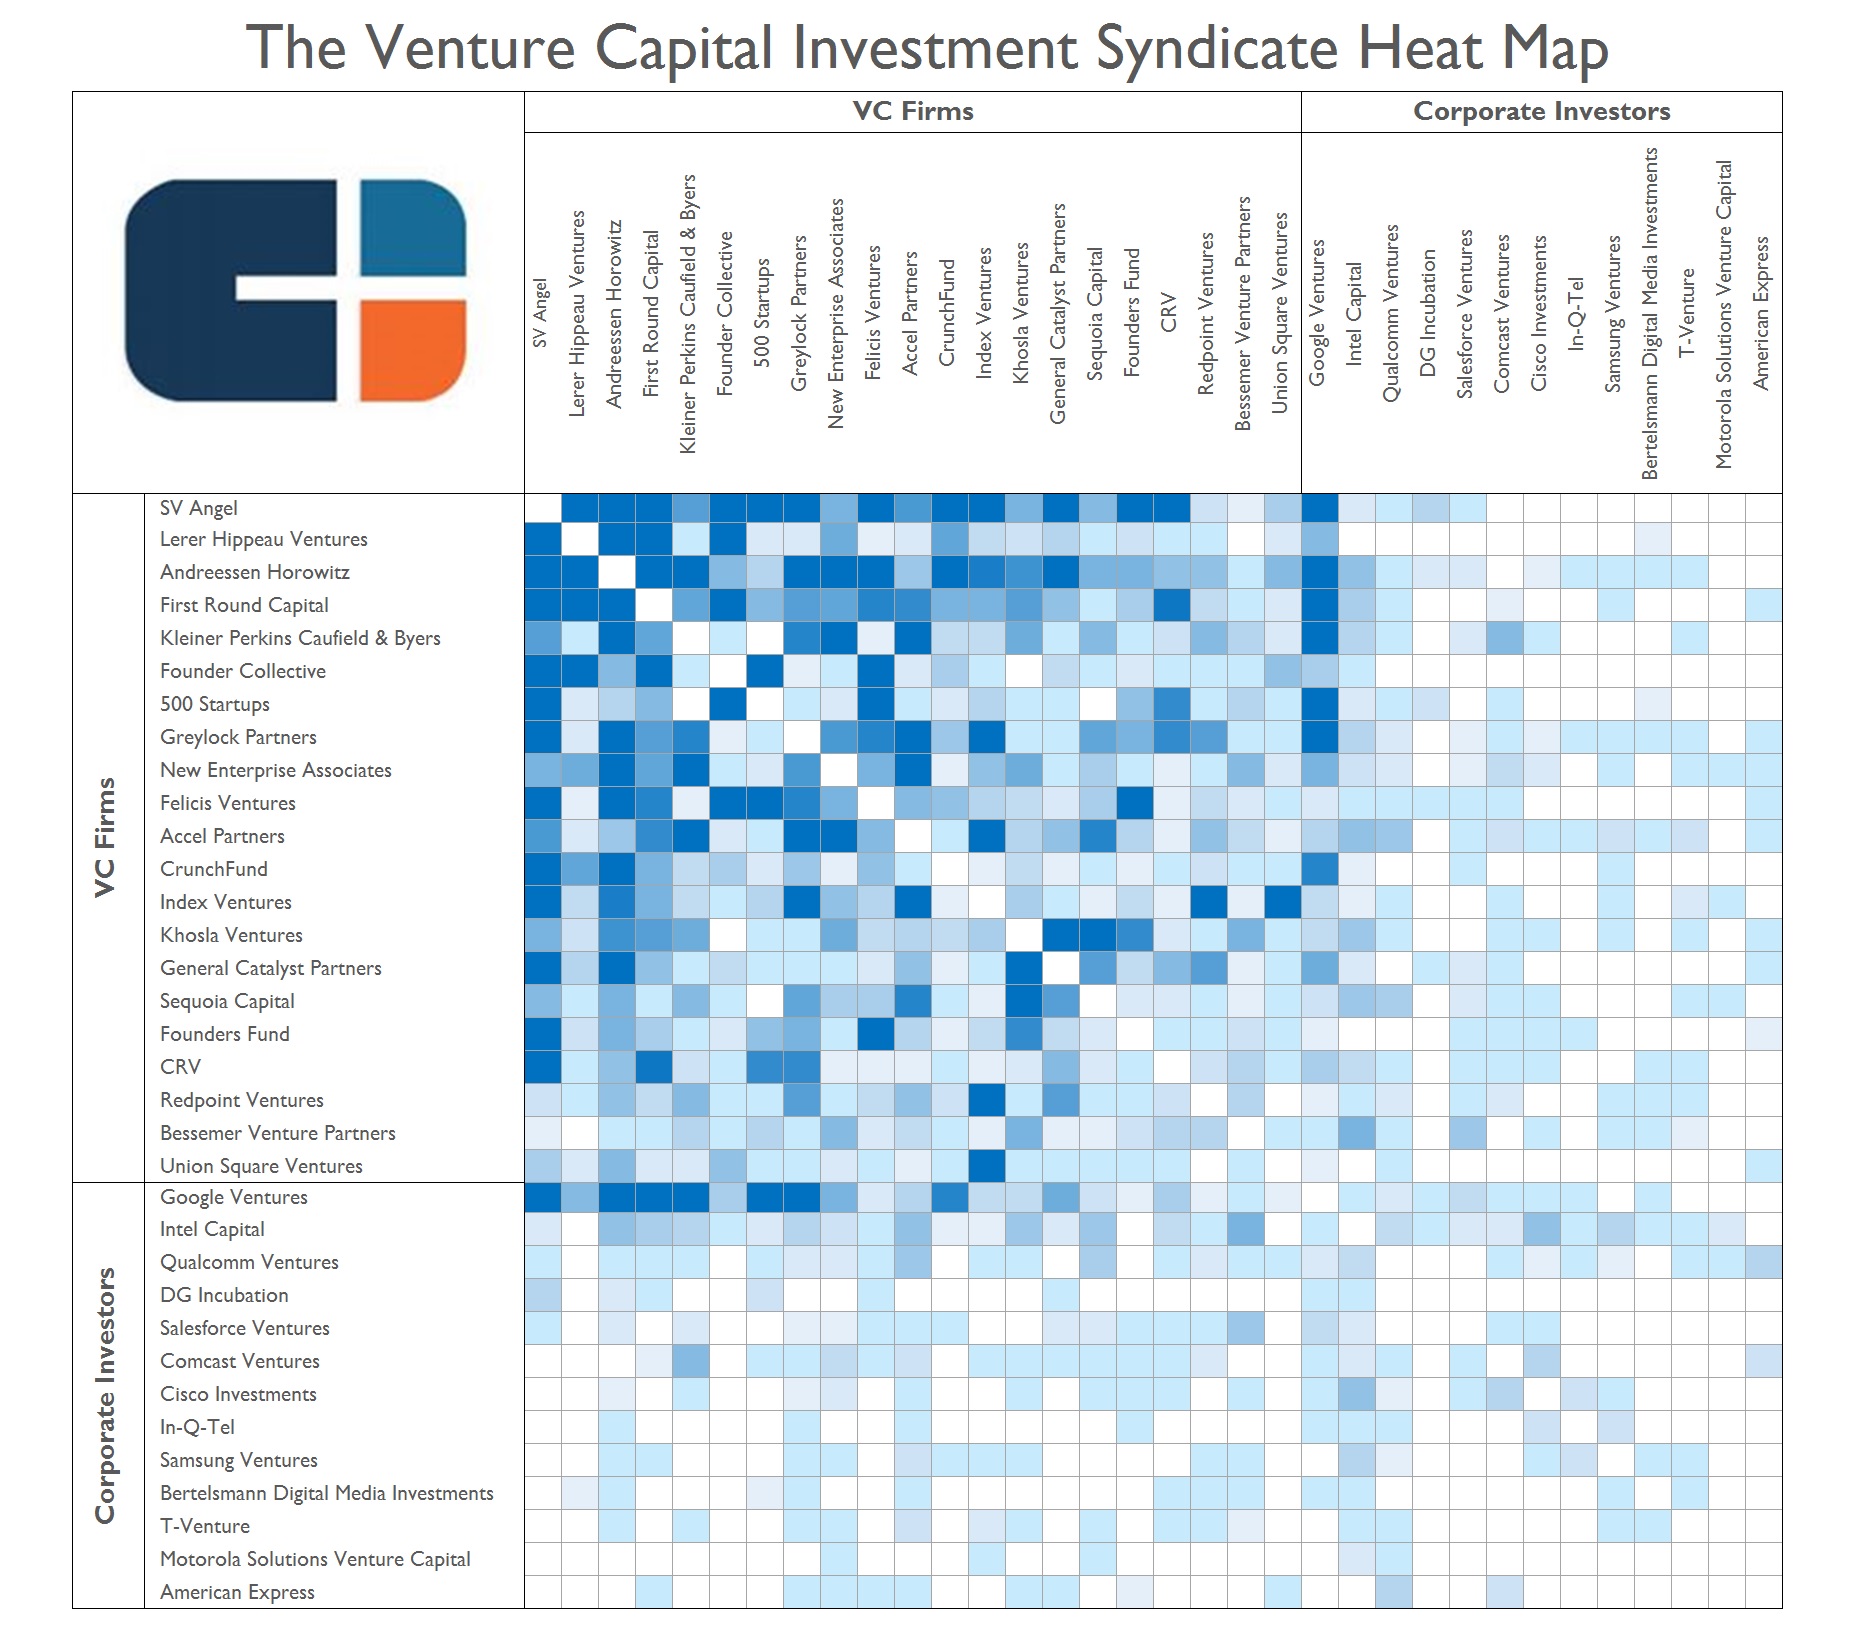
What we discovered surprised us.

The familar, widely endorsed patterns of investment behaviour at the group portfolio level...


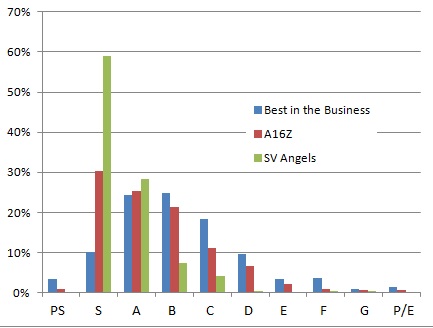
Didn't hold up at the individual investor level.


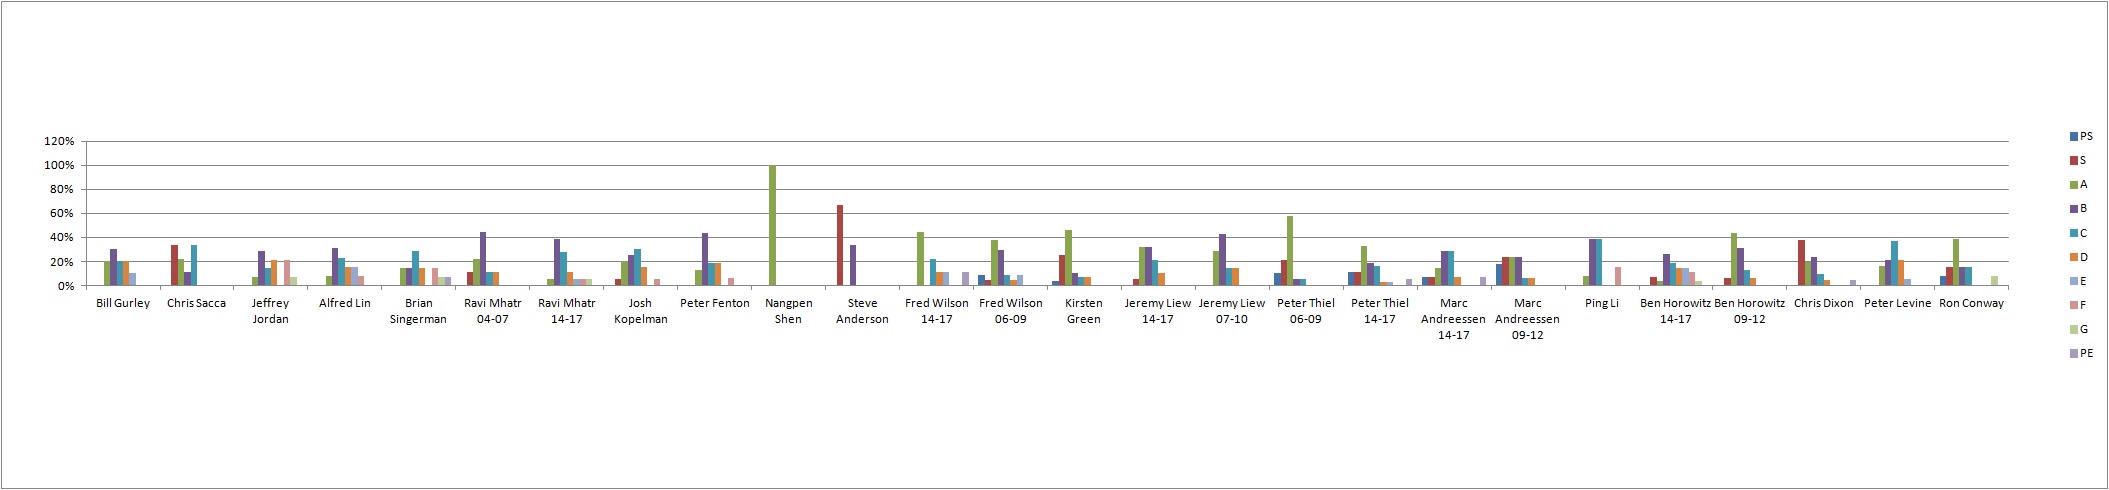
Mapping the habits of the Top 100 VC's revealed a random walk.

What sports enthusiasts would call a case of "Hot Hands".

Suggesting the popular insights published by the leading VC's on how to profit from the great disruption of paper to be nothing more than stories of survivour bias.


This meant our journey was not just about automating industry best practice but one of deconstructing the narrative to discover the exceptions that prove the rule.


The signal in all the noise.


To demonstrate that venture capital portfolio management correlates with a random walk here is a market simulation comparing VC Investment Strategies with gambling at the Roulette Table.


This first chart maps the random walk of 10 VCs placing 10 Bets per Year for 10 Years at the Roulette Table.


The model demonstrates the random returns of the baseline bet for each VC Portfolio plus the impact of 'Doubling' down and/or 'Spread Betting' on subsequent bets if they win.


If you re-run the simulation 10x you will see a pattern of 'Hot Hands" emerging from the random walk.


It is evident that Investment Returns in excess of 4x can be achieved simply by being:
a. Lucky, and
b. Playing the right "investment" Strategy


This second chart maps the random walk of speculating in the world of Early Stage and Growth Start-ups vs playing Roulette.


What the model illustrates is Venture Capital is less risky than playing Roulette. But Roulette offers bigger returns, in a fraction of the time, if you win.


Note: This model is geared towards amplifying VC 'Hot Hands' success at twice the rate of the Roulette players 'lucky streak'. It is also net portfolio management fees.


This final graph compounds the tally of investment returns from each re-run of the simulation.


As the pool of investors grows we discover that Venture Capital Portfolio Management is less about "hitting the ball out of the park" and more about limiting the downside risk through industry standard portfolio management practices and doubling down on the occassional 'winner'. (i.e. Minimising the losses, while placing enough bets in the hope you get lucky, and then doubling down on those lucky bets.)


This is why investing in commercialisation (Growth Stage) is a safer bet than investing in innovation (Seed/Early Stage).


The problem being these practices result in the majority of portfolio returns being no better than the Market Index Funds (e.g S&P100 & S&P500) without the liquidity of the stock market.


The Best of Breed Investment Parcel represents the market maker. The VC whose market profile stimulates invitations from other VCs to participate in the funding of pre-qualified high growth opportunities. It points to a level of market complexity beyond individual VCs making bets in isolation. It demonstrates how the market leaders aggregate and leverage the outliers to amplify portfolio returns.


The Best of Breed Model suggests the RoboVC challenge isn't just about building a better monkey or a better dartboard. It also entails designing a better network of investments.

Disclaimer

The use of these calculators, charts, visualisations, data or any information shall be at the user’s sole risk. Such use shall constitute a release and agreement to hold harmless, defend and indemnify Digital Partners from and against any liability (including but not limited to liability for special, indirect or consequential damages) in connection with such use. Such release from and indemnification against liability shall apply in contract, tort (including negligence of such party, whether active, passive, joint or concurrent), strict liability, or other theory of legal liability; provided, however, such release, limitation and indemnity provisions shall be effective to, and only to, the maximum extent, scope or amount allowable by law.

Questions of accuracy

Tymbals is an experiment in machine learning and statistical modelling of small data pools. Tymbals is still under development. It is still learning. Tymbals is Beta - i.e. Pre-release.

The probabilities and outputs (e.g. calculators, charts, visualisations) will evolve and change as the system ingests more data.

Tymbals is a probability model. The results generated by Tymbals are market estimates based on the cummulative value of the data within the distributed data pools.

Privacy

All data inputs are automatically added to the learning pool from which Tymbals models are generated.

If you do not want your data added the data pool do not use Tymbals


Copyright 2017-2018 Digital Partners Pty Limited. All Rights Reserved