The 2022 series on Phase Changes was about mapping the requirements for a new marketing dashboard
How could we merge the language of the CMO into the language of the CFO?
A composite of the original thread can be found here
This post is a pivot on that idea
How could we merge the language of the CFO into the language of the CMO?
It begins by observing there are 3 key financial reports generated by the CFO for the financial markets
We have the Balance Sheet, the Operating Statement and the Cashflow Statement
This is what the marketing equivalent might look like...
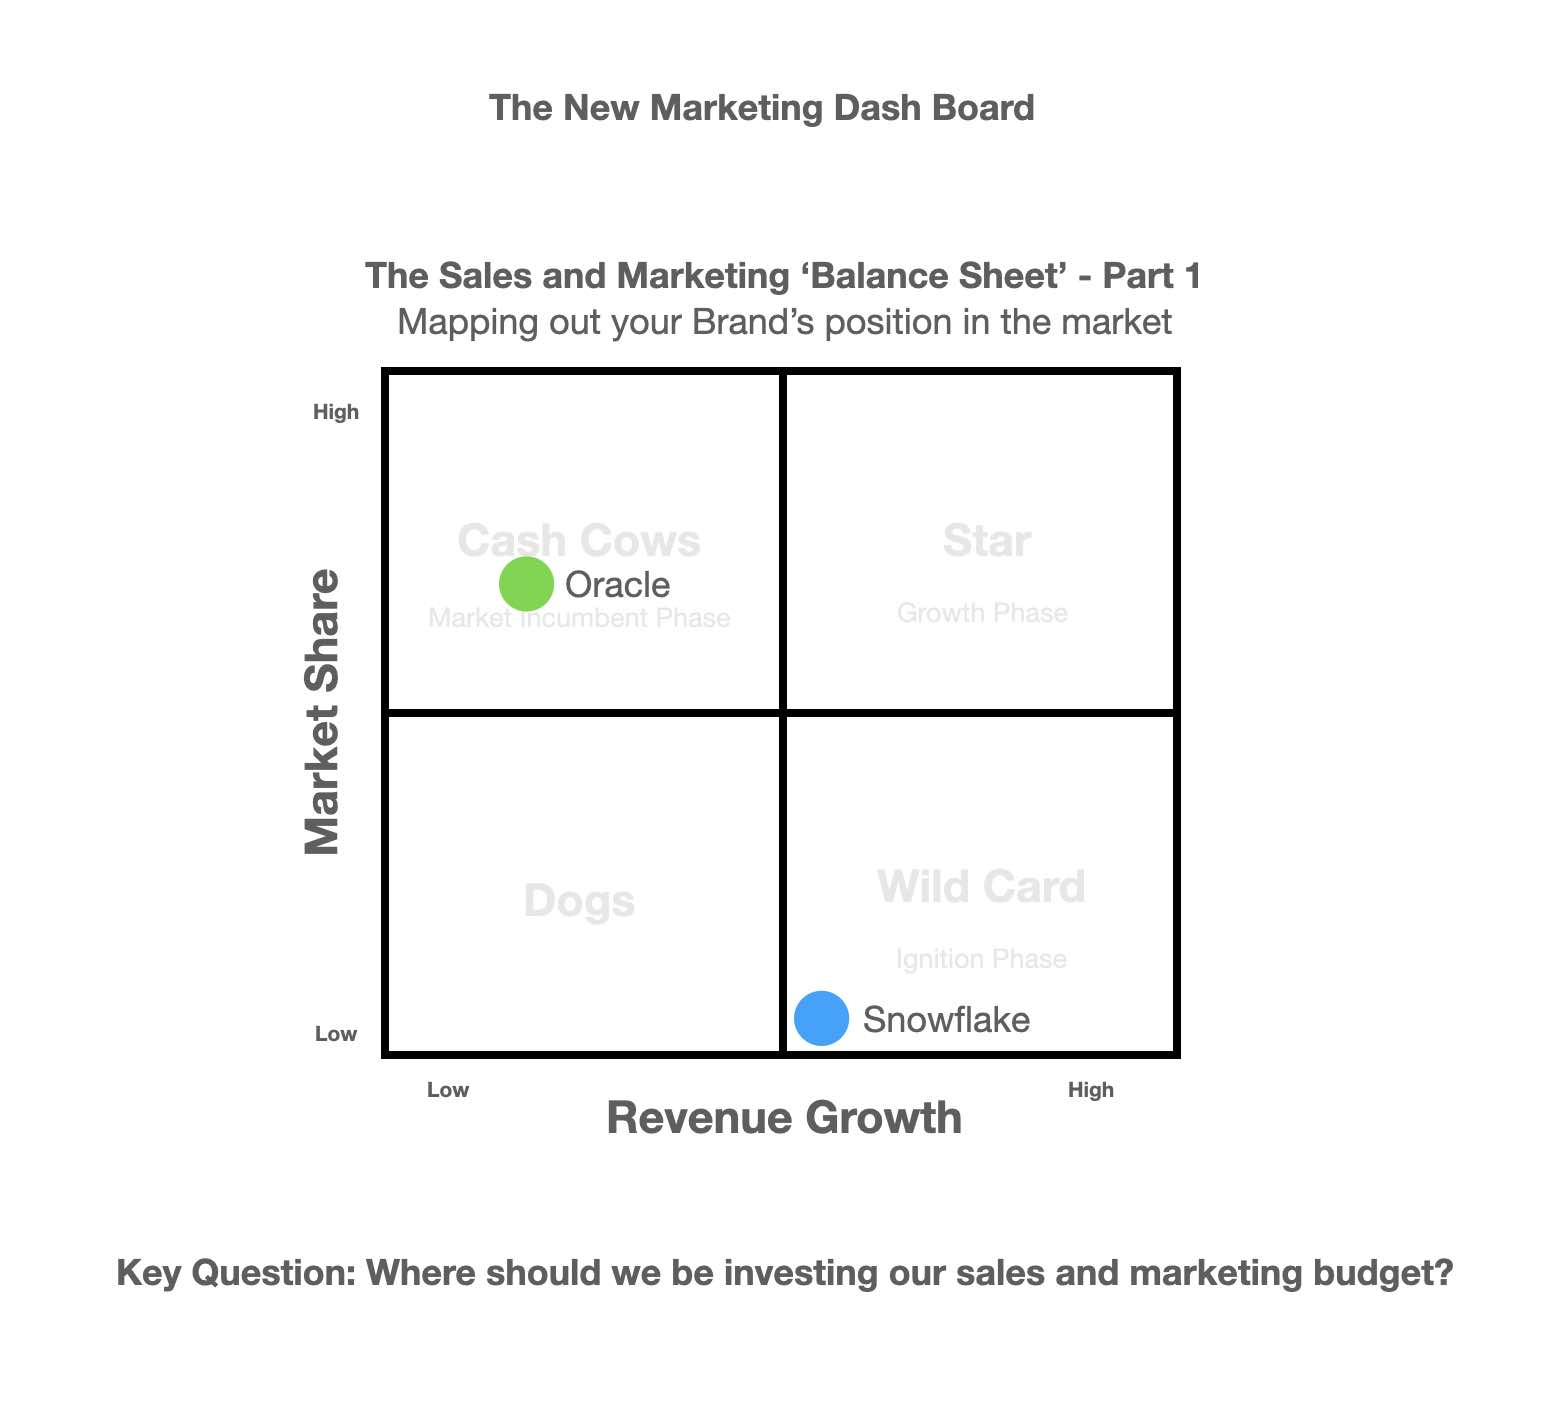
The New Marketing Balance Sheet
The Marketing Balance Sheet is easy. It is basically the Boston Box (also known as the BSG Growth-Share Matrix)
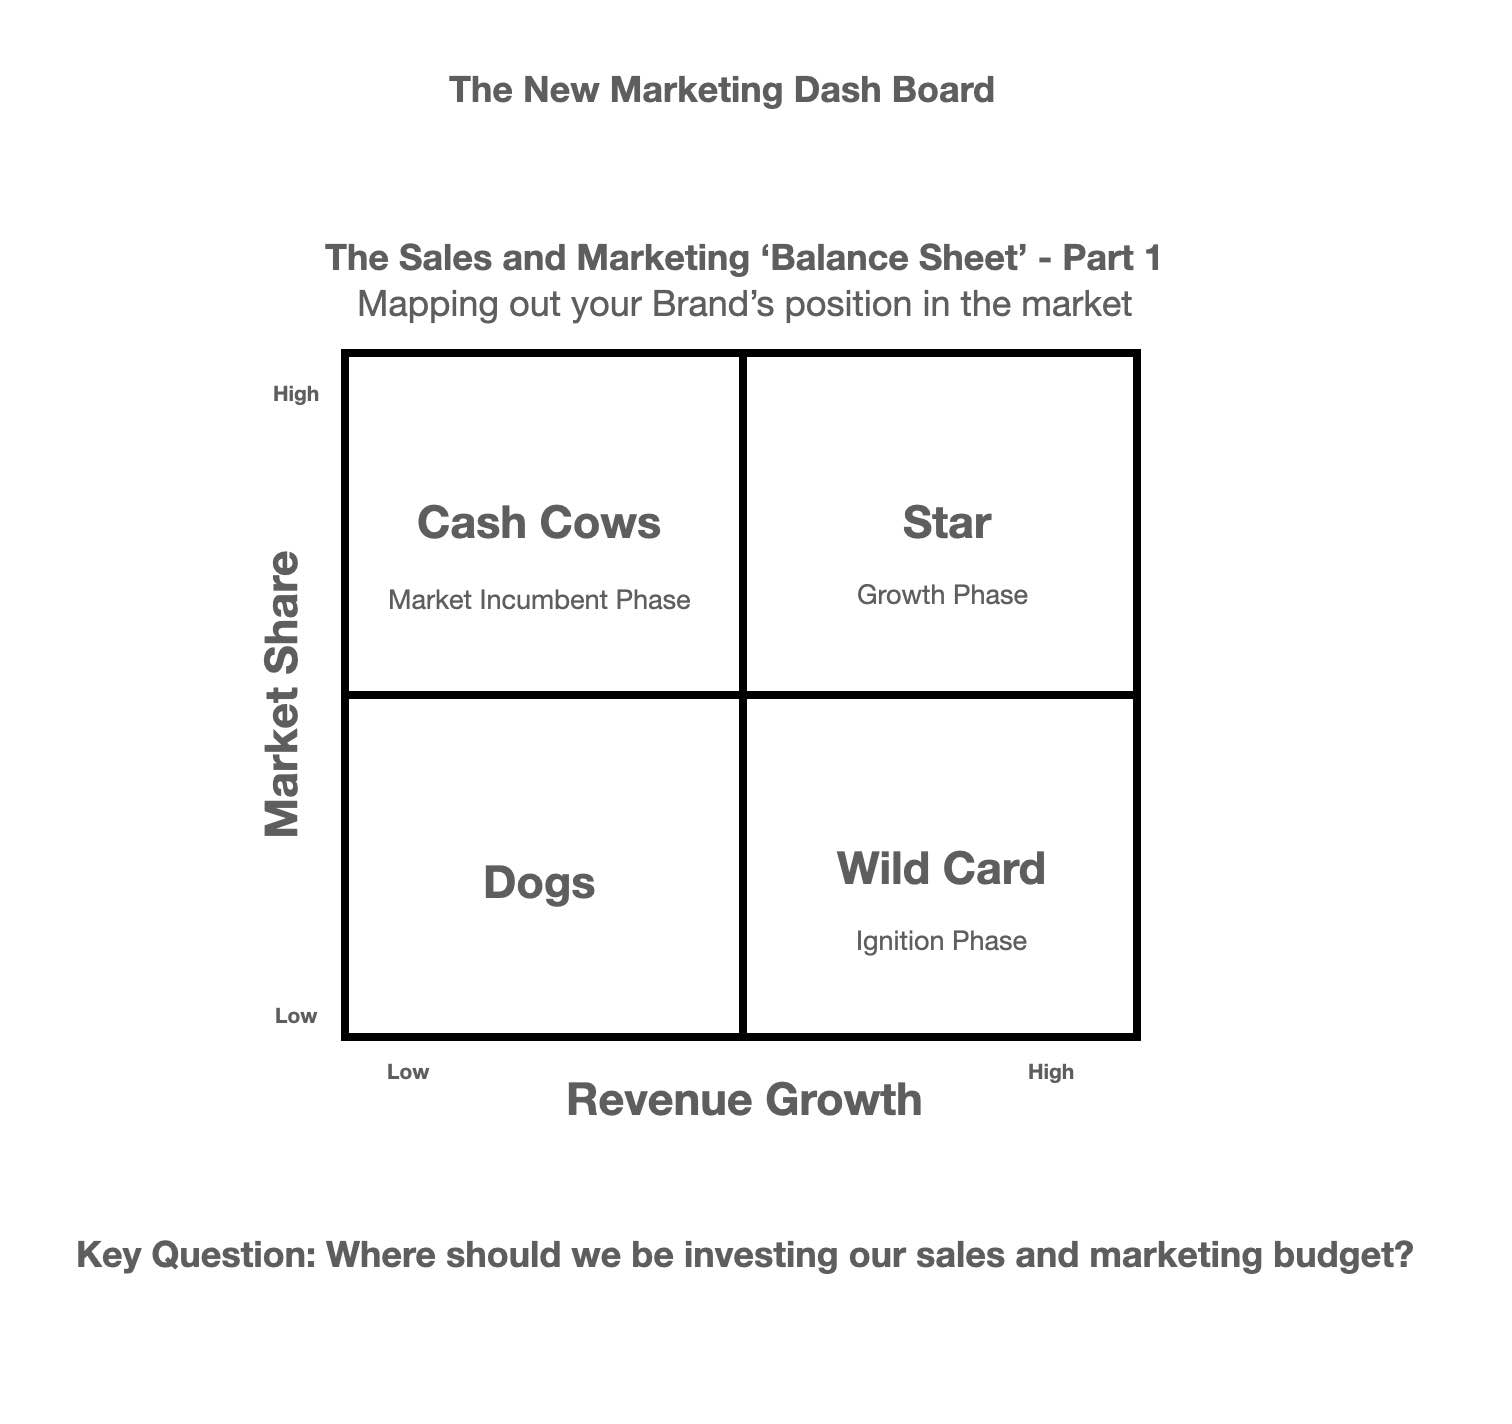
It shows us where we are in the market
and we can take that idea a step further to map how efficient we are compared to the market
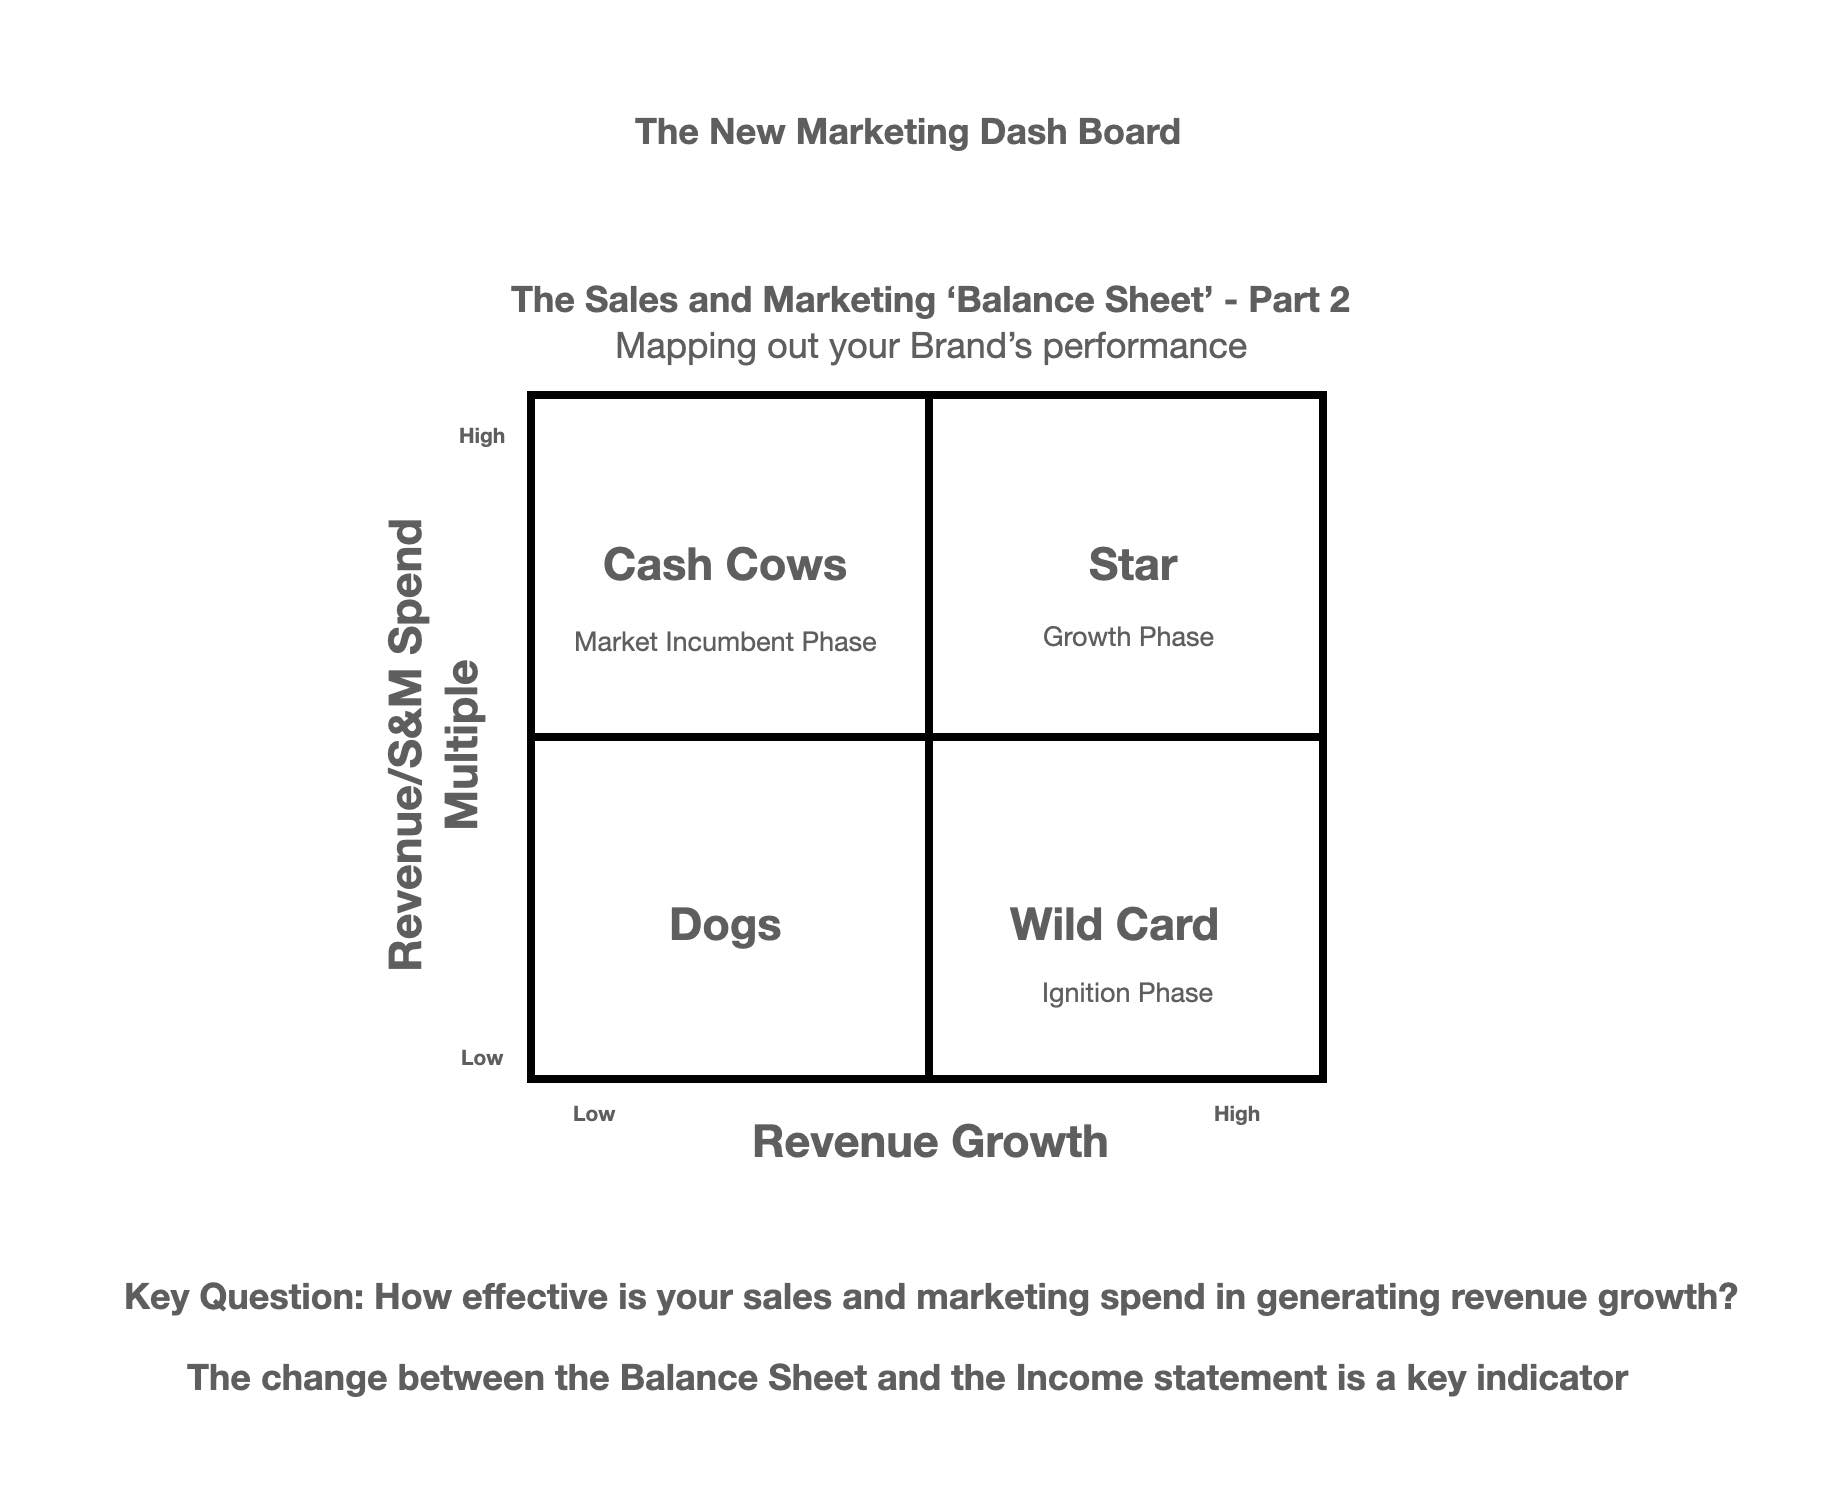
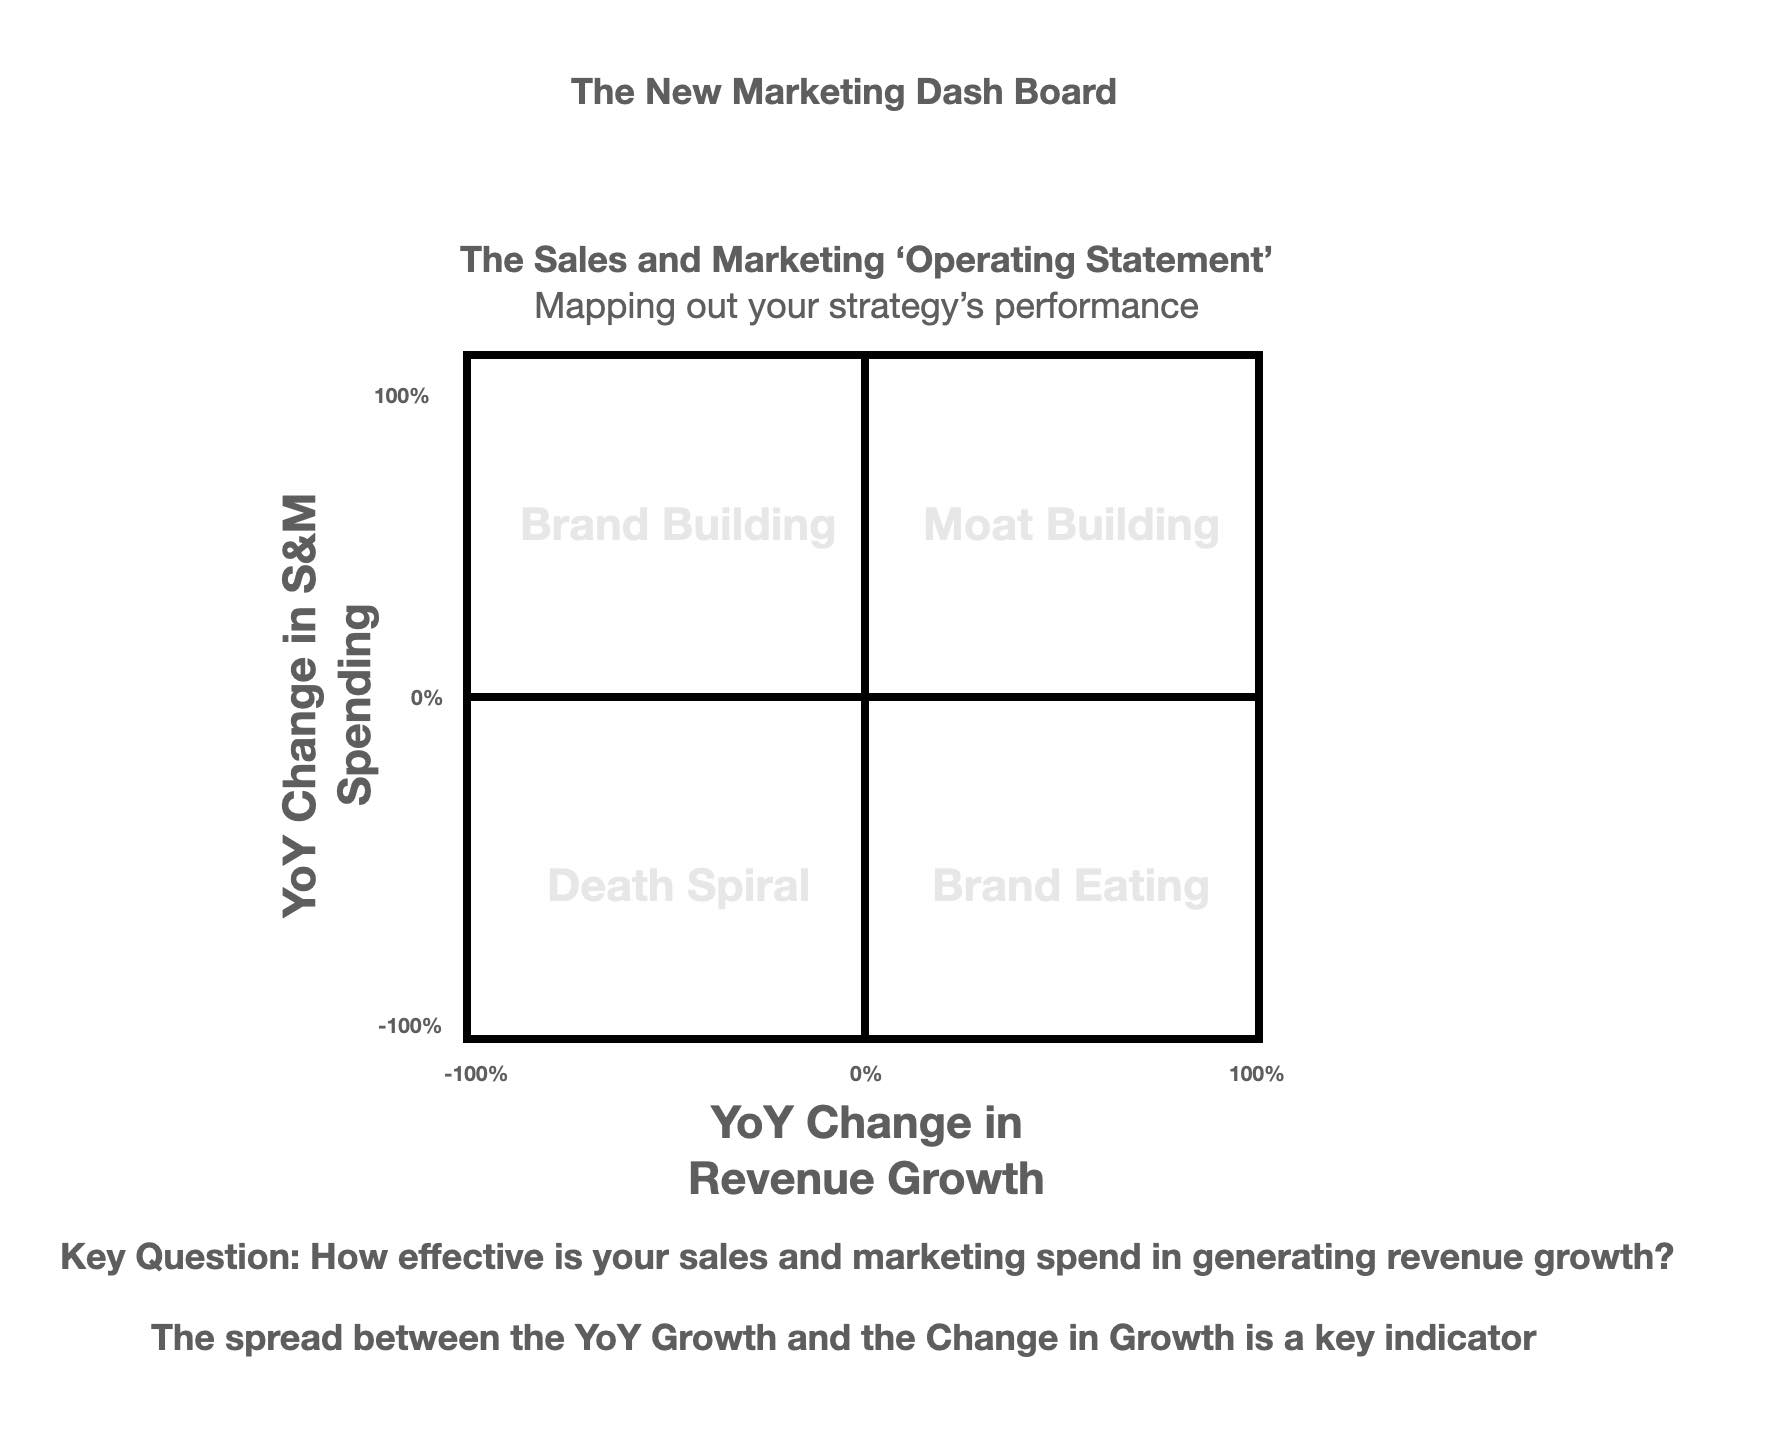
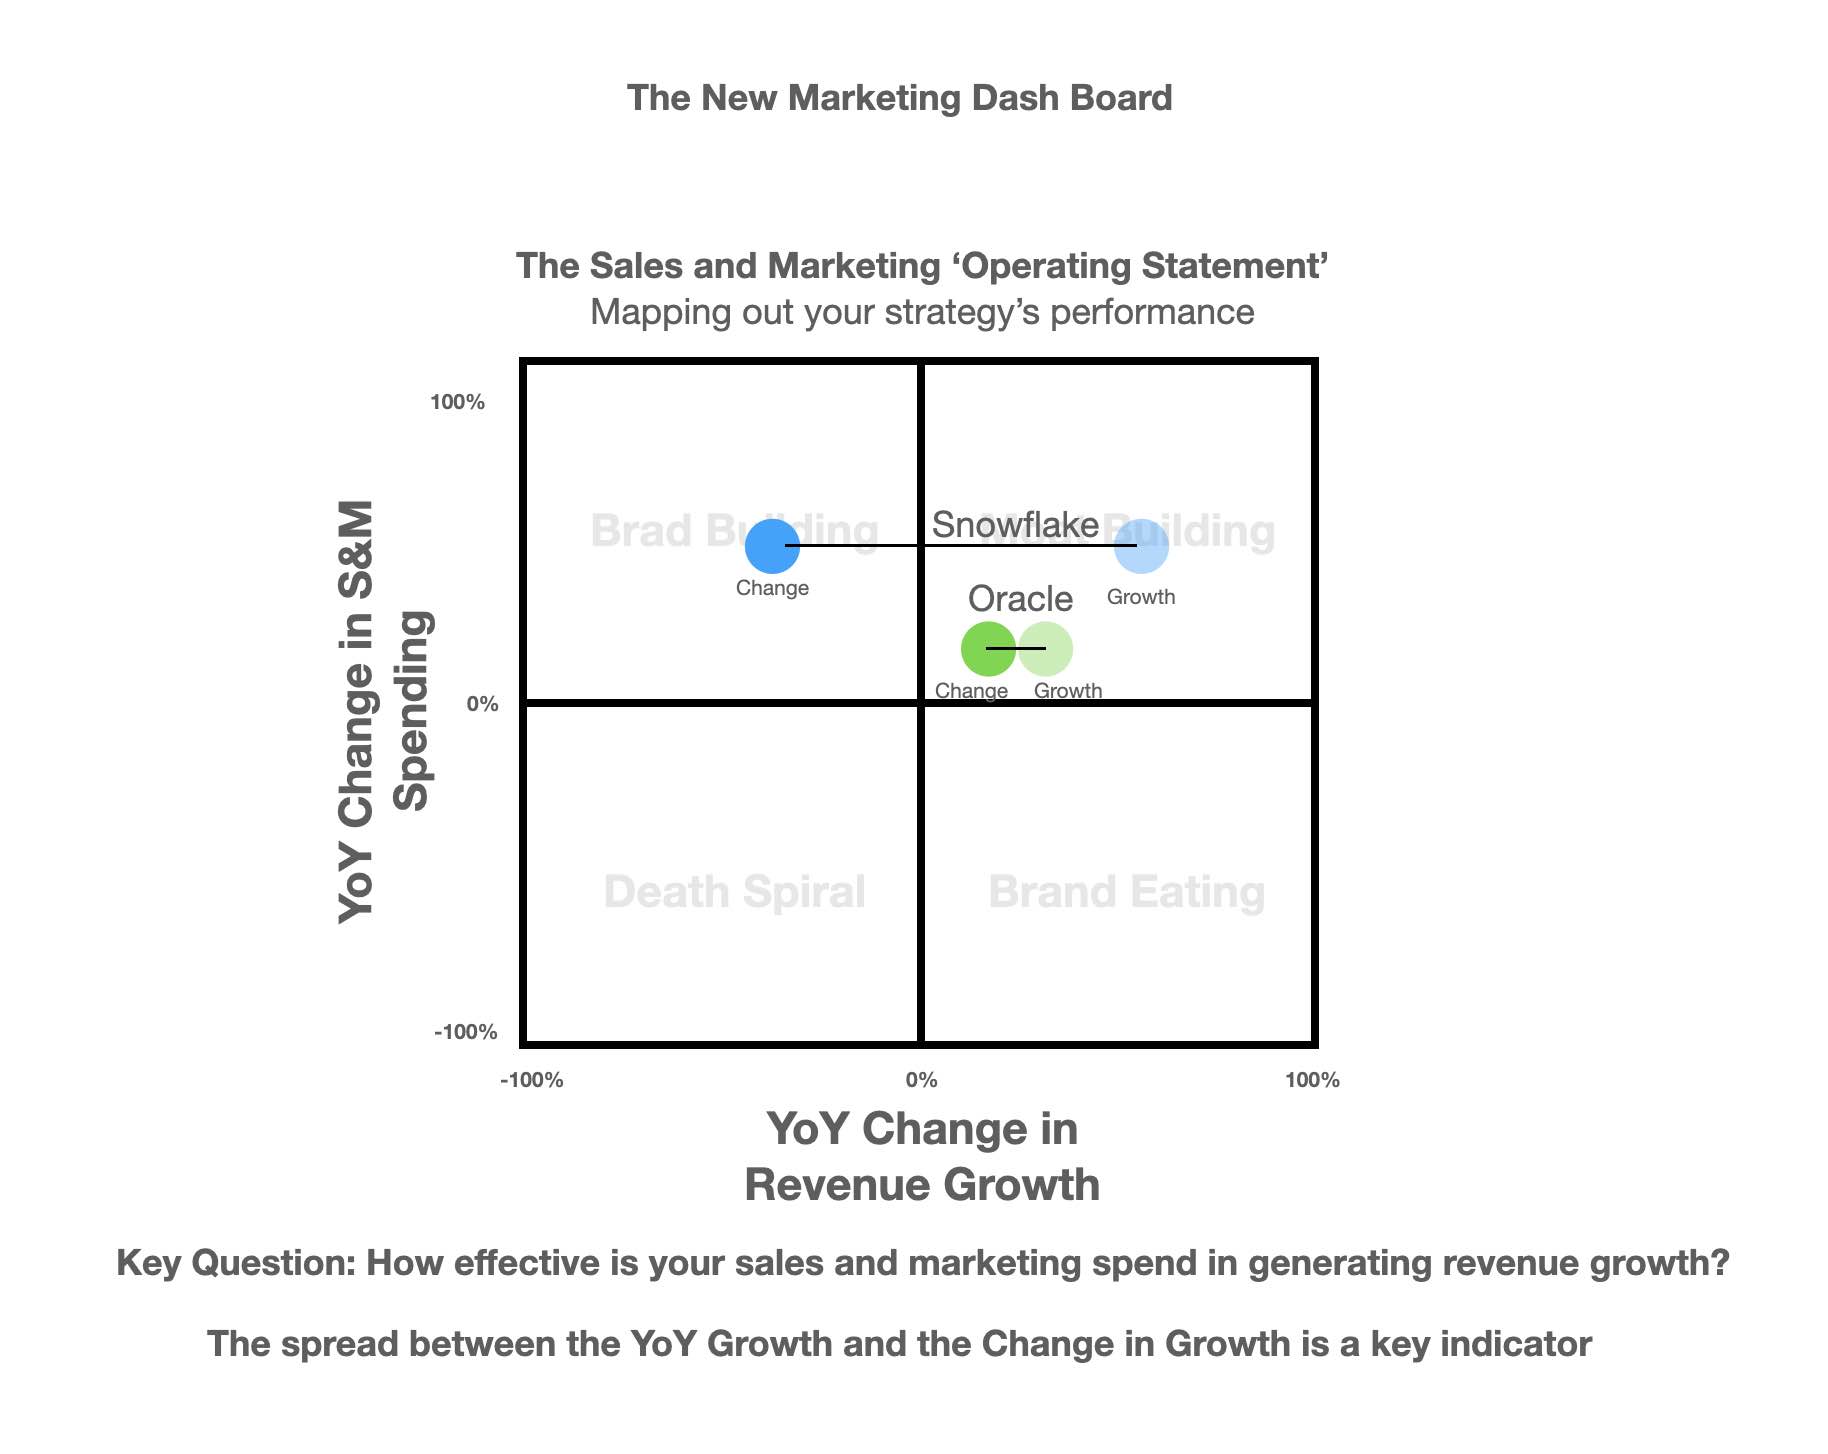
The New Marketing Operating Statement
Now we have mapped our market position let's move on to mapping the efficiency of our sales and marketing spend over the past 12 months
We can do this by comparing the change in sales and marketing expenditure with the change in revenue growth
This requires two sets of growth calculations. The first is the YoY Change in Revenue vs the change sales and marketing spend - This is the change in revenues you will find in a company's Quarterly Report
We use this as the performance benchmark across the portfolio
The next metric maps the change in the change in growth over the past 12 months vs the previous 12 months prior vs the change in spend
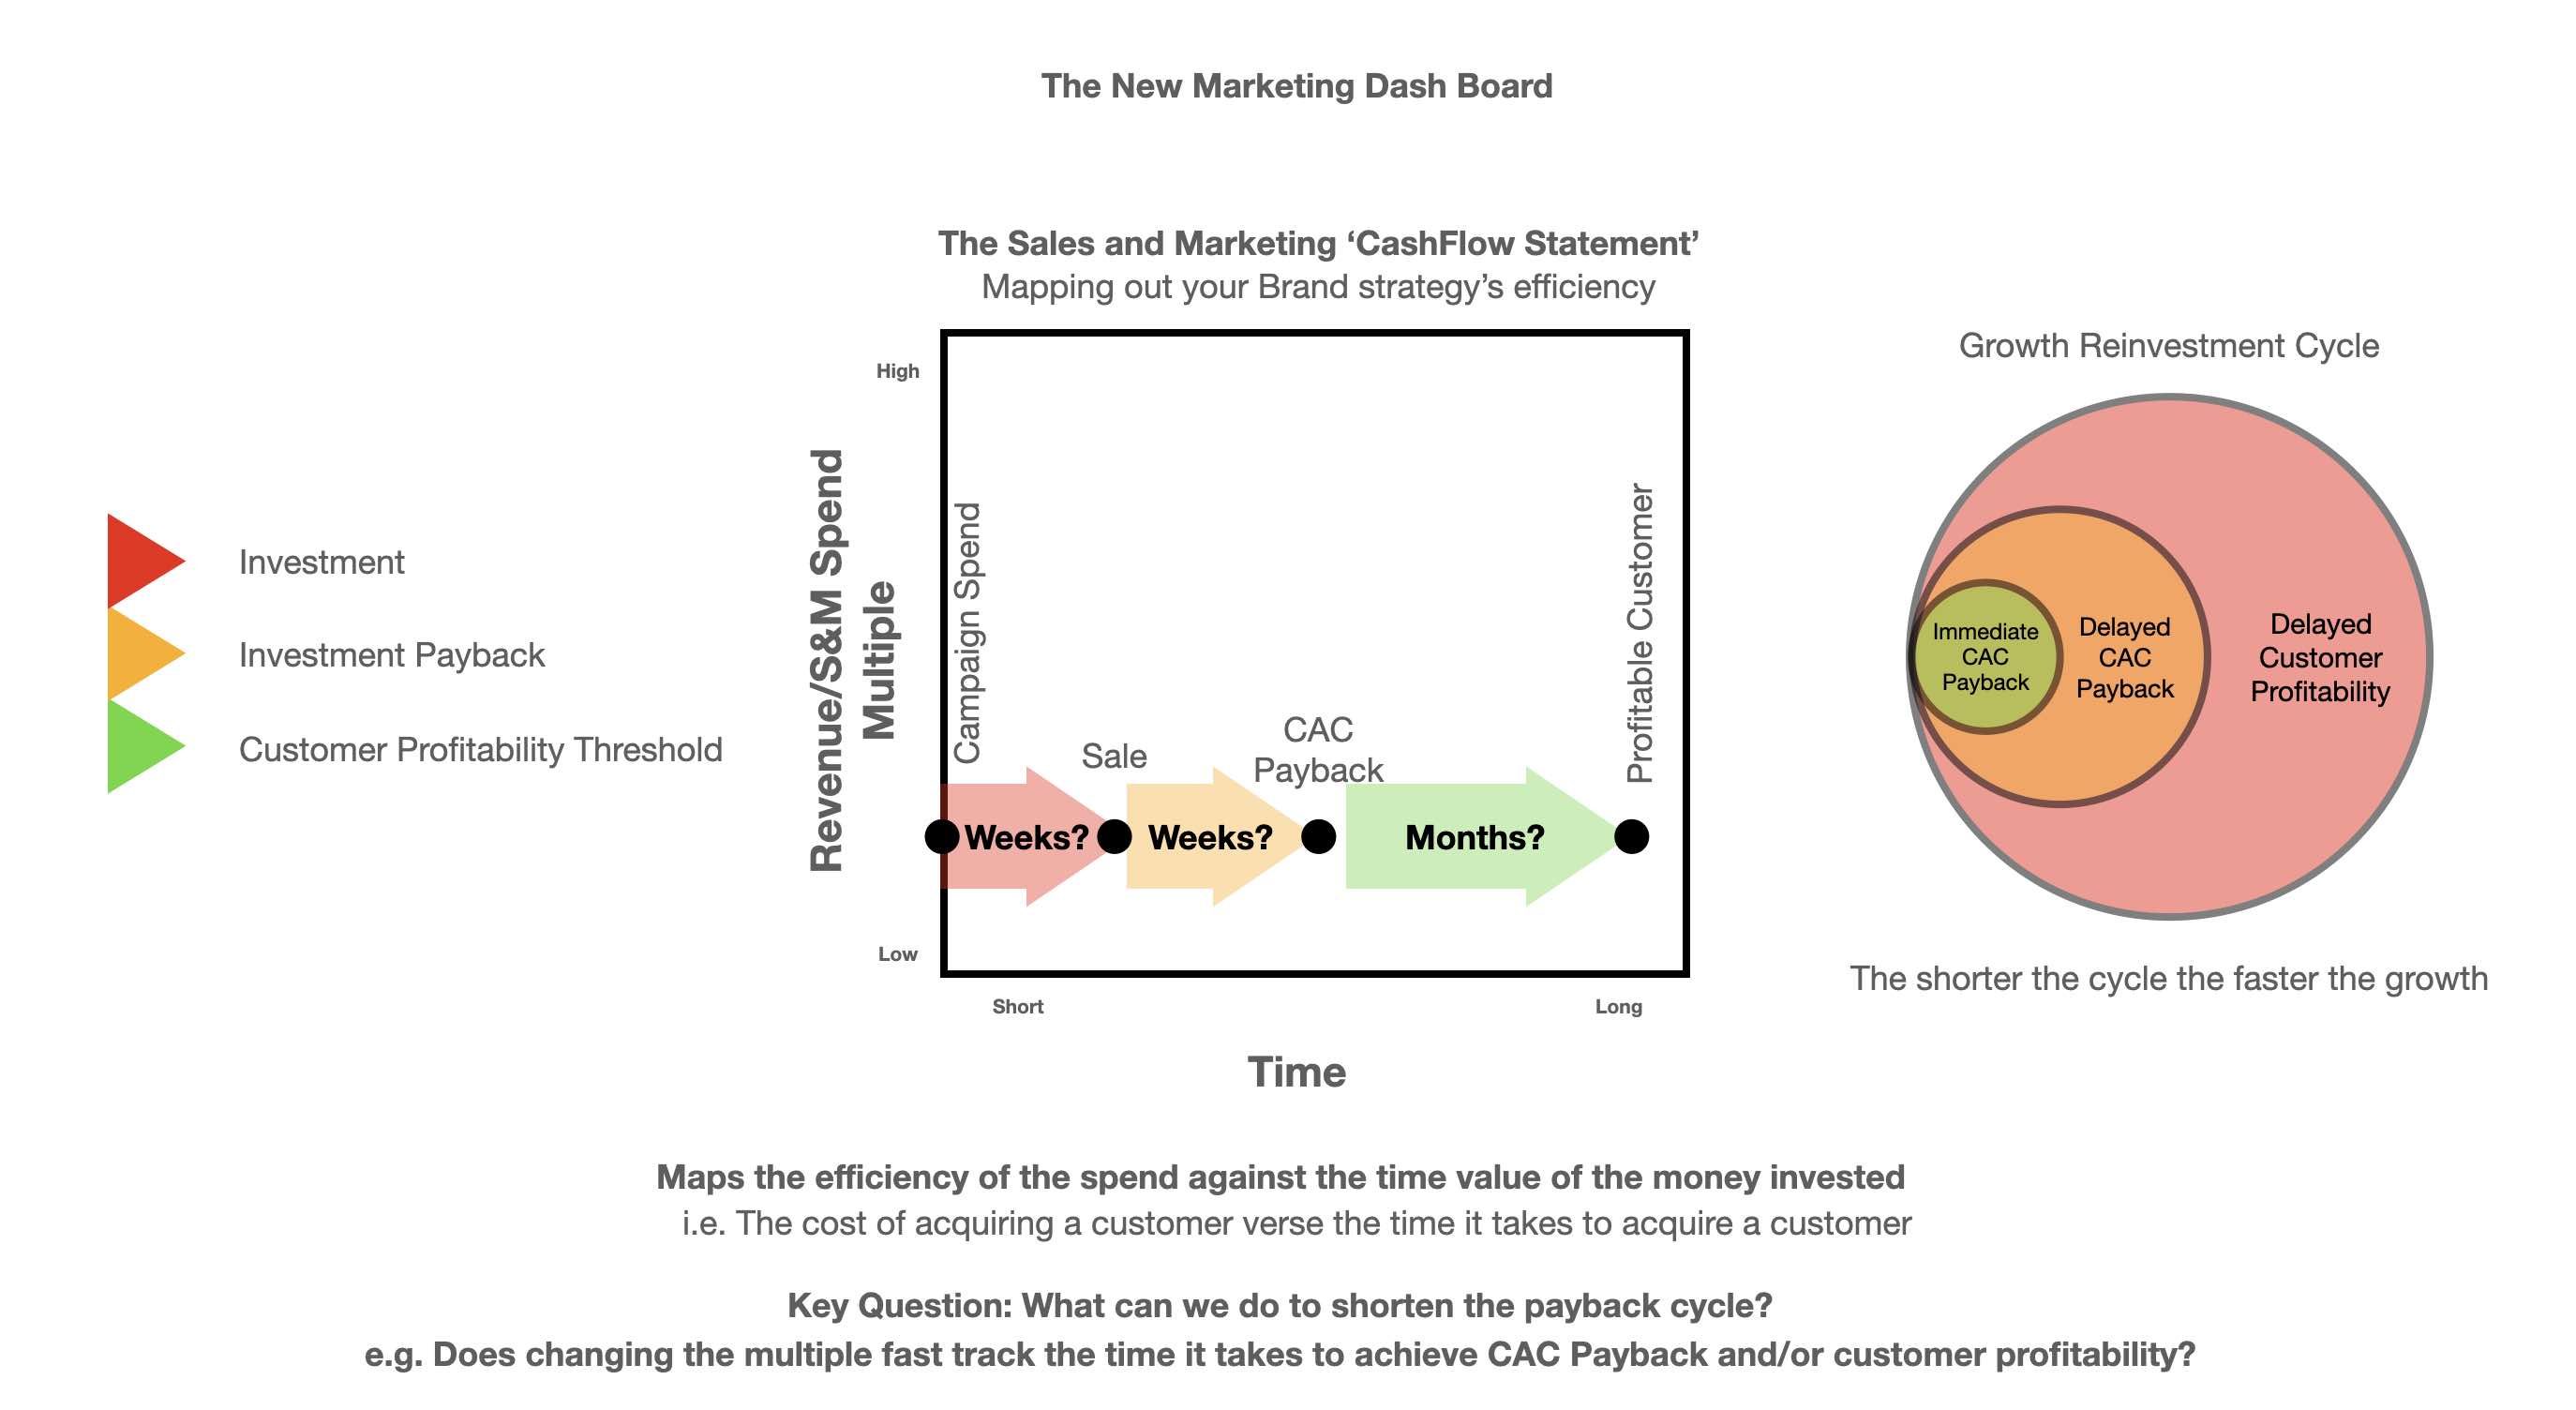
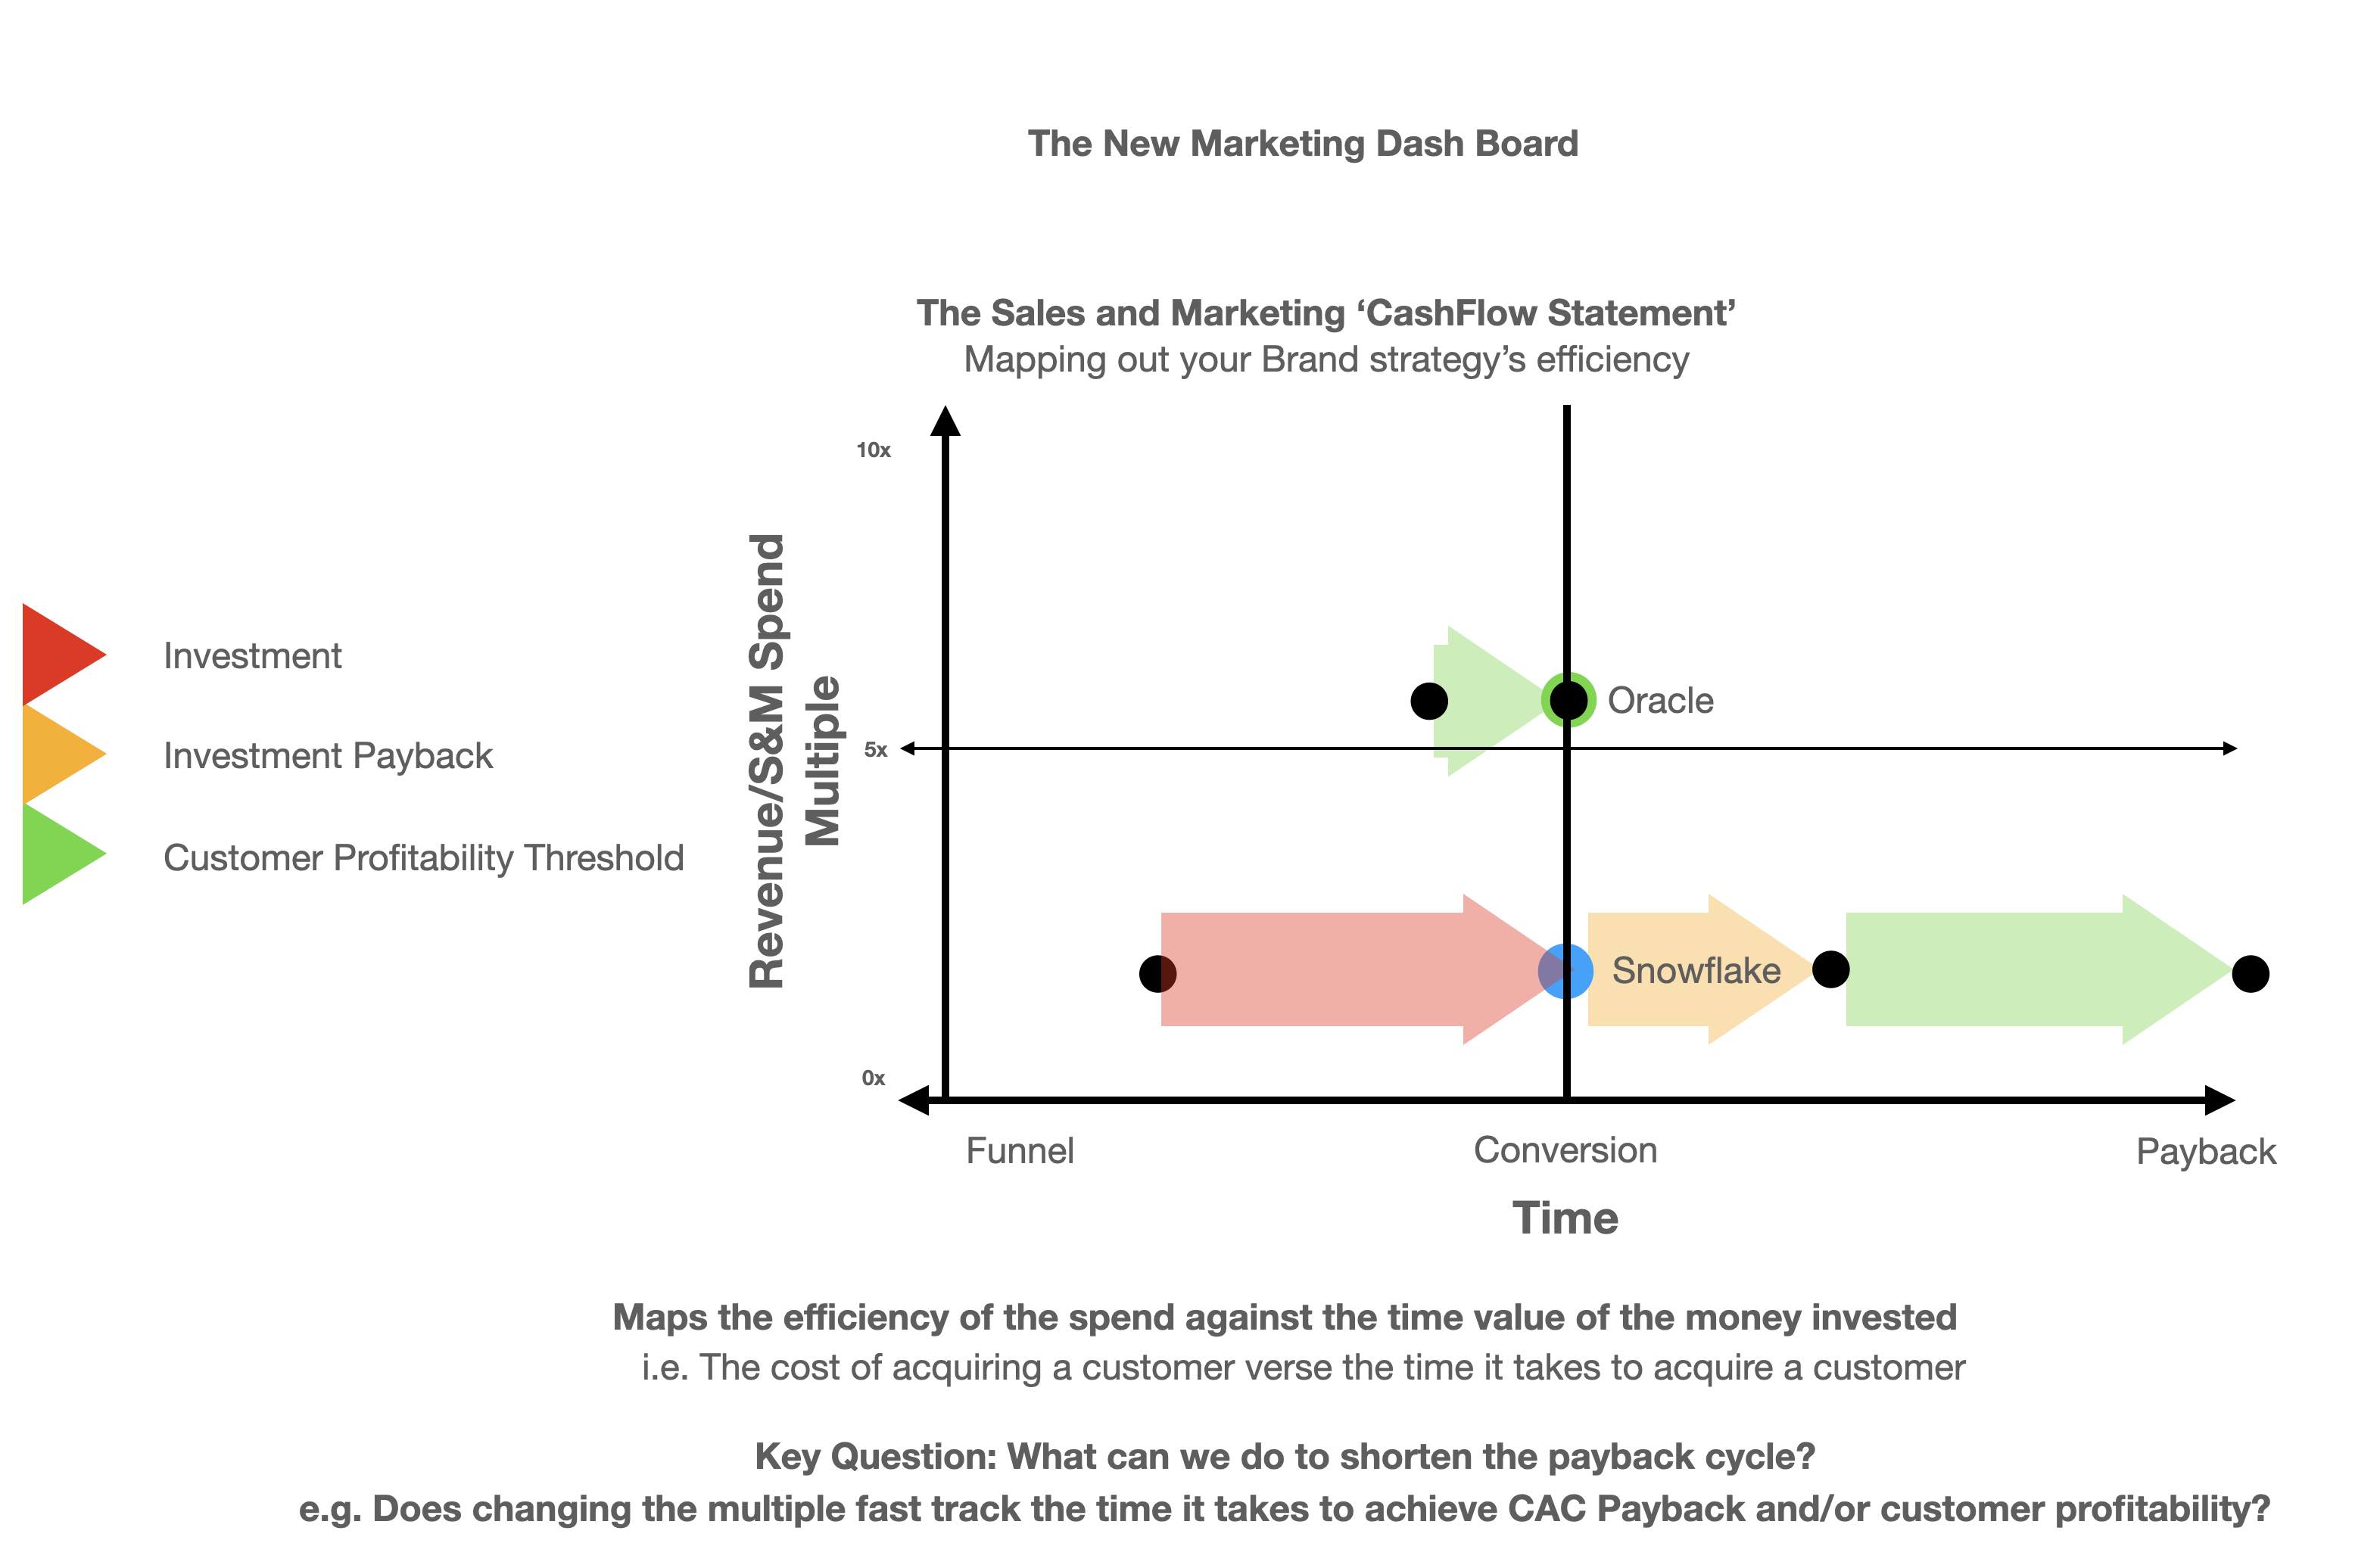
The New Marketing Cash Flow Statement
The next step is to reimagine this relative efficiency as marketing cashflow
and by that I mean. We may or may not be efficient but how effective are we in converting prospects into customers?
We begin with the phase changes. We map where we are in the market cycle
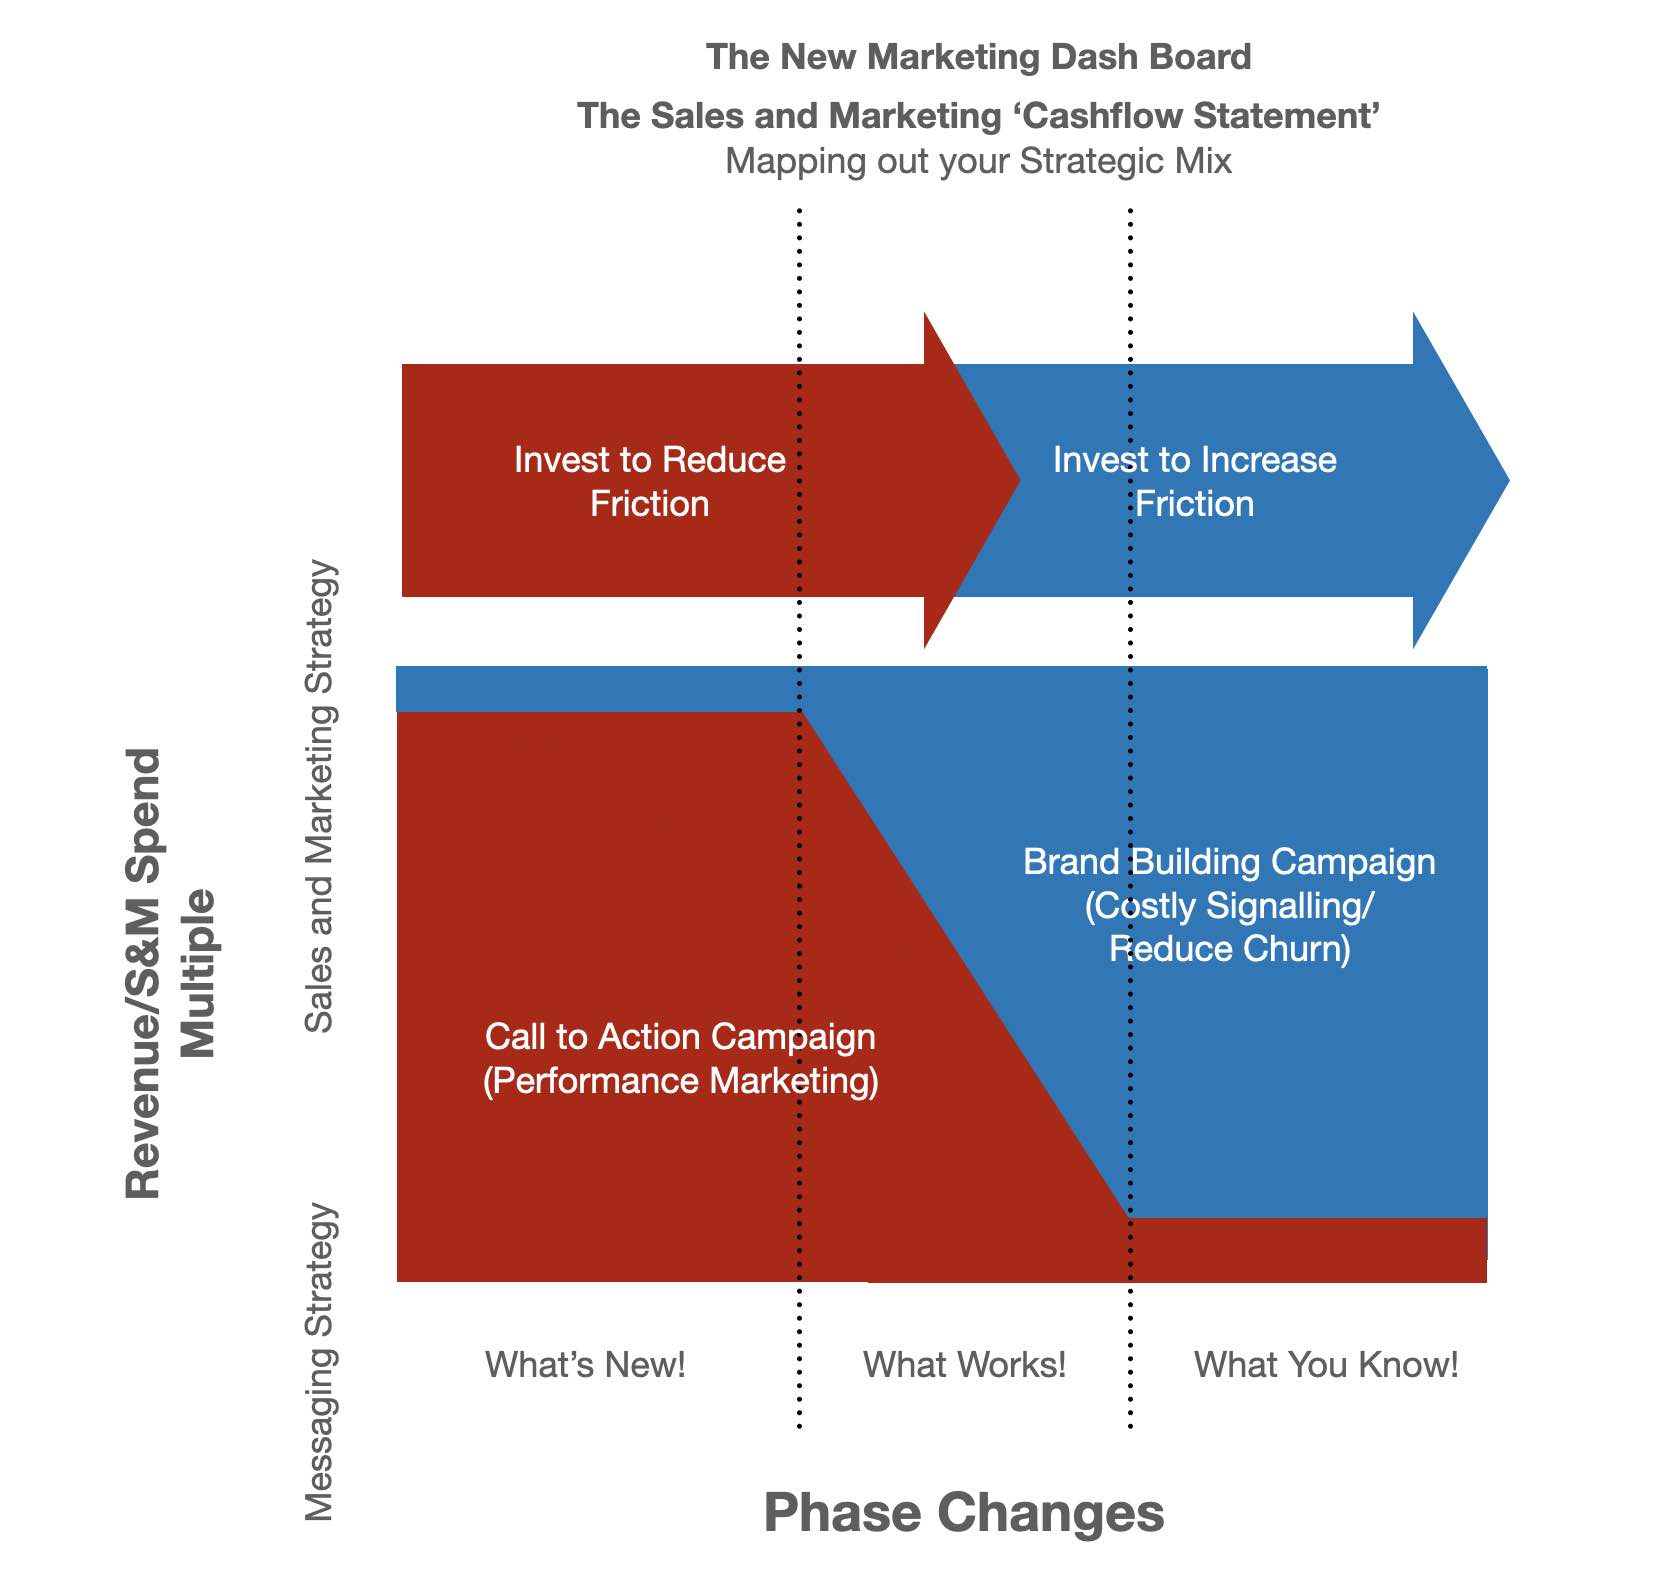
And then we move onto the hard bit. Now we must map both the phase and the efficiency to determine our relative effectiveness
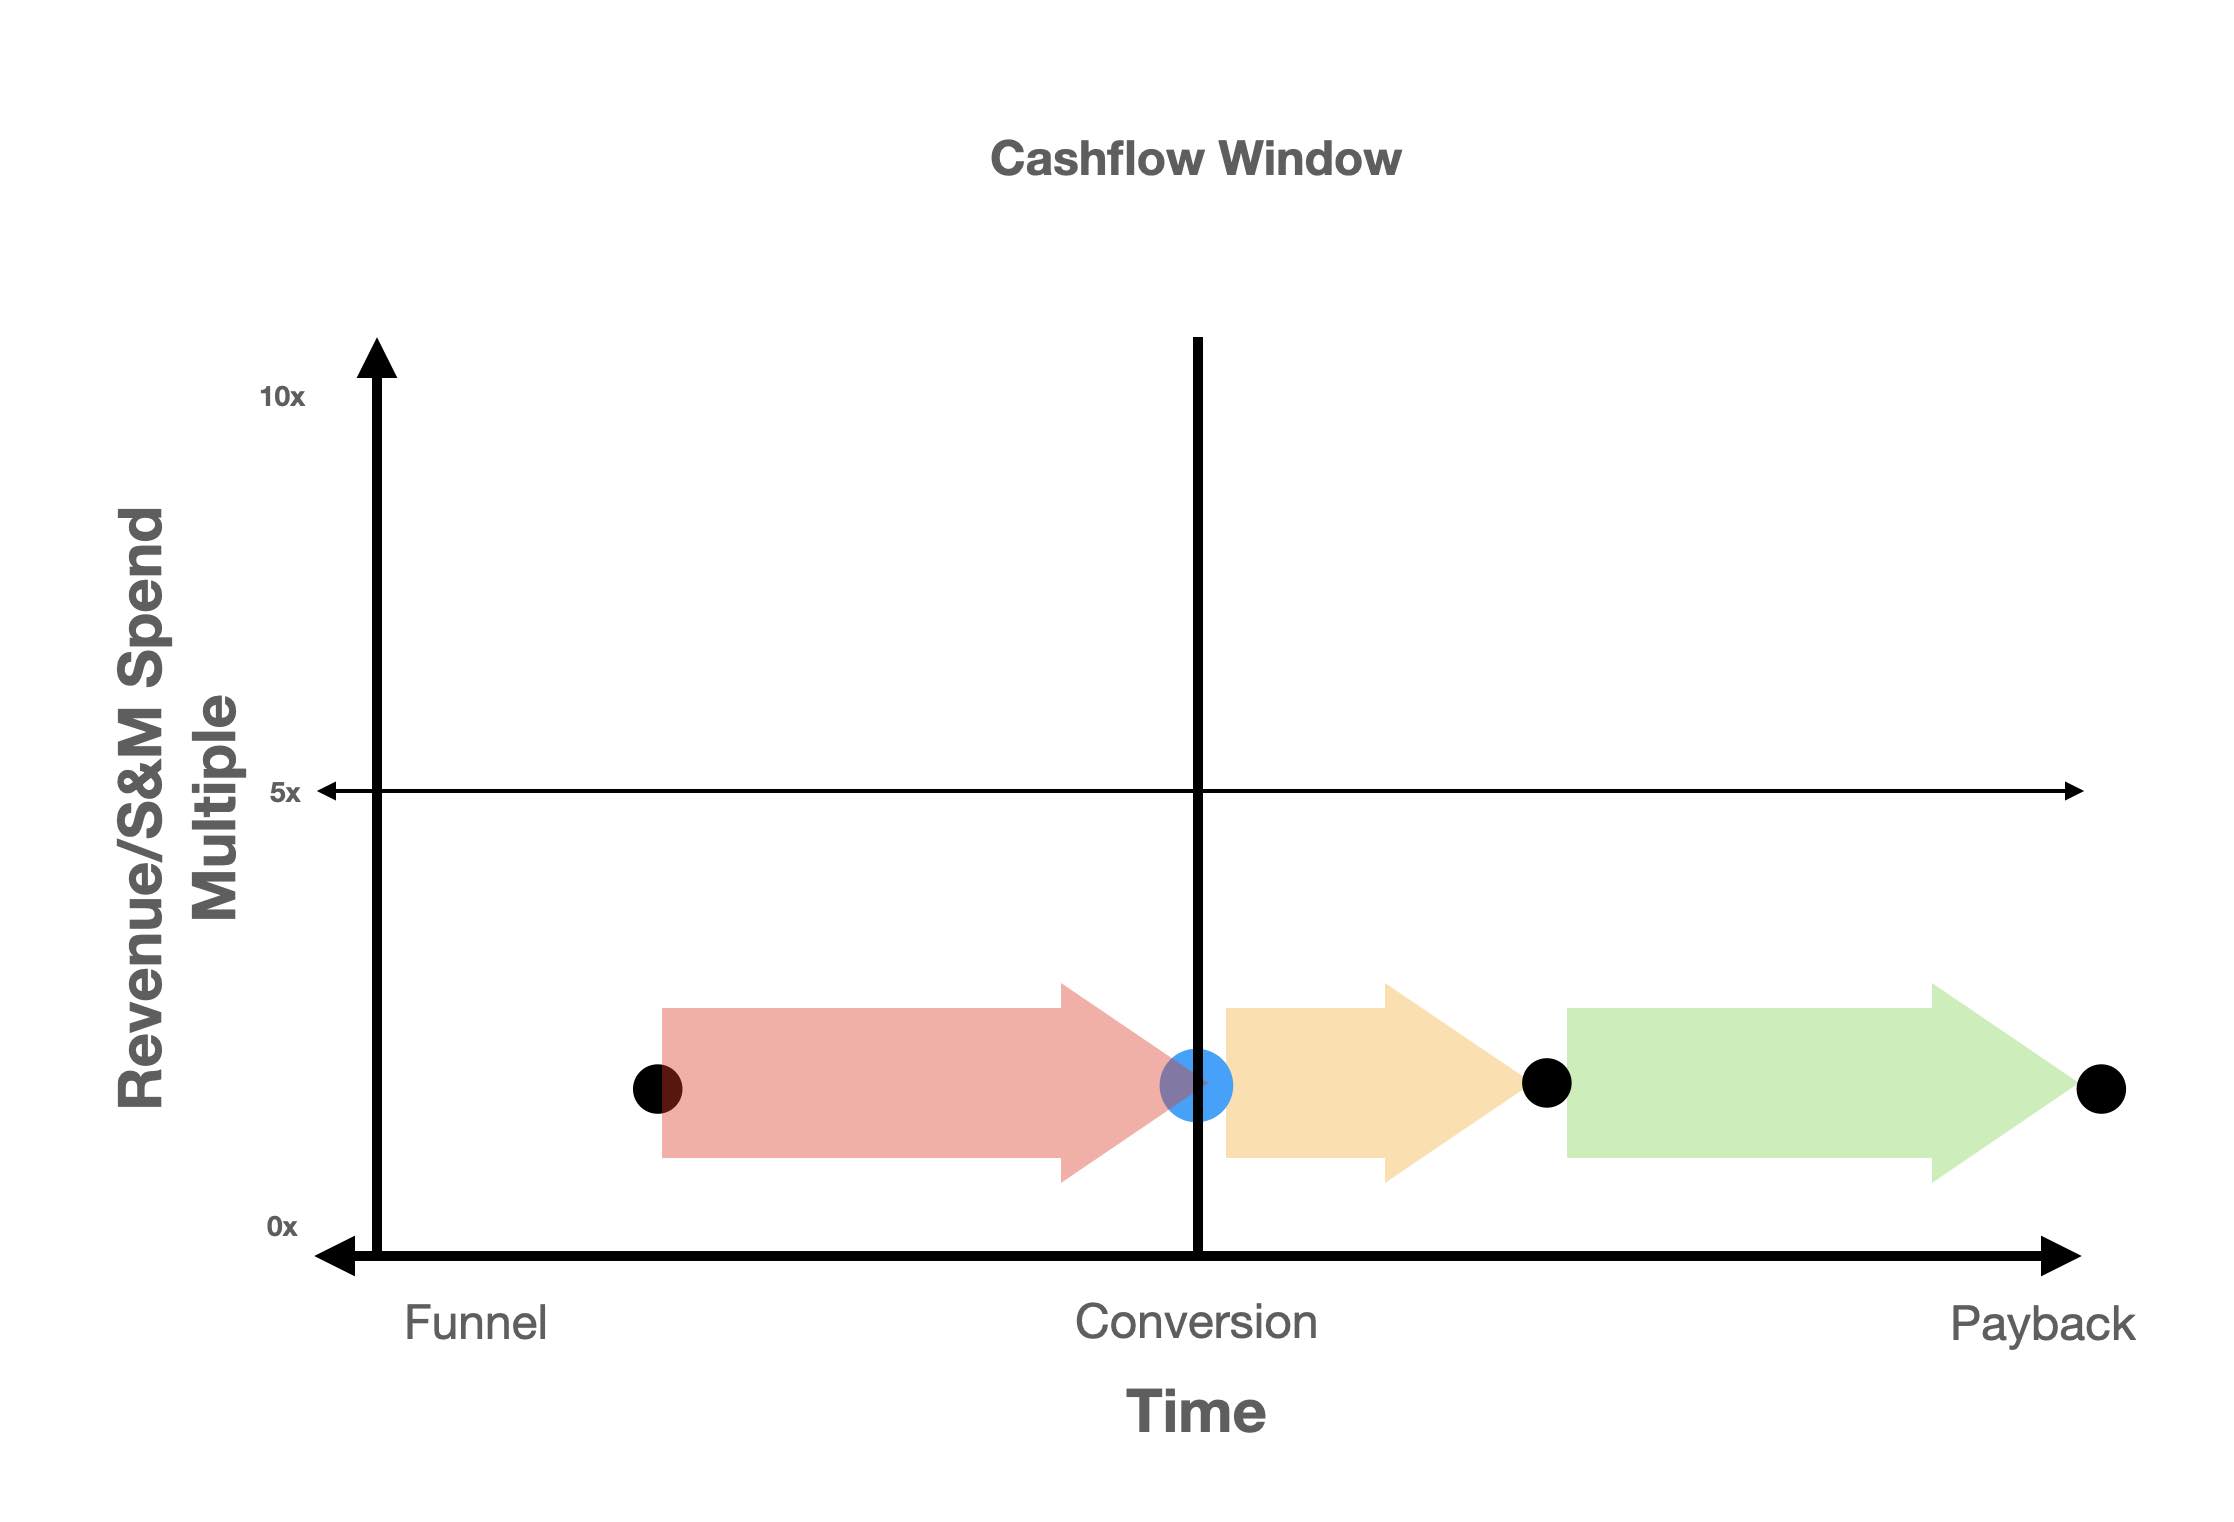
Now this idea can be expressed more simply by centering the conversion and then spliting the timeline into the funnel and payback/profitability windows
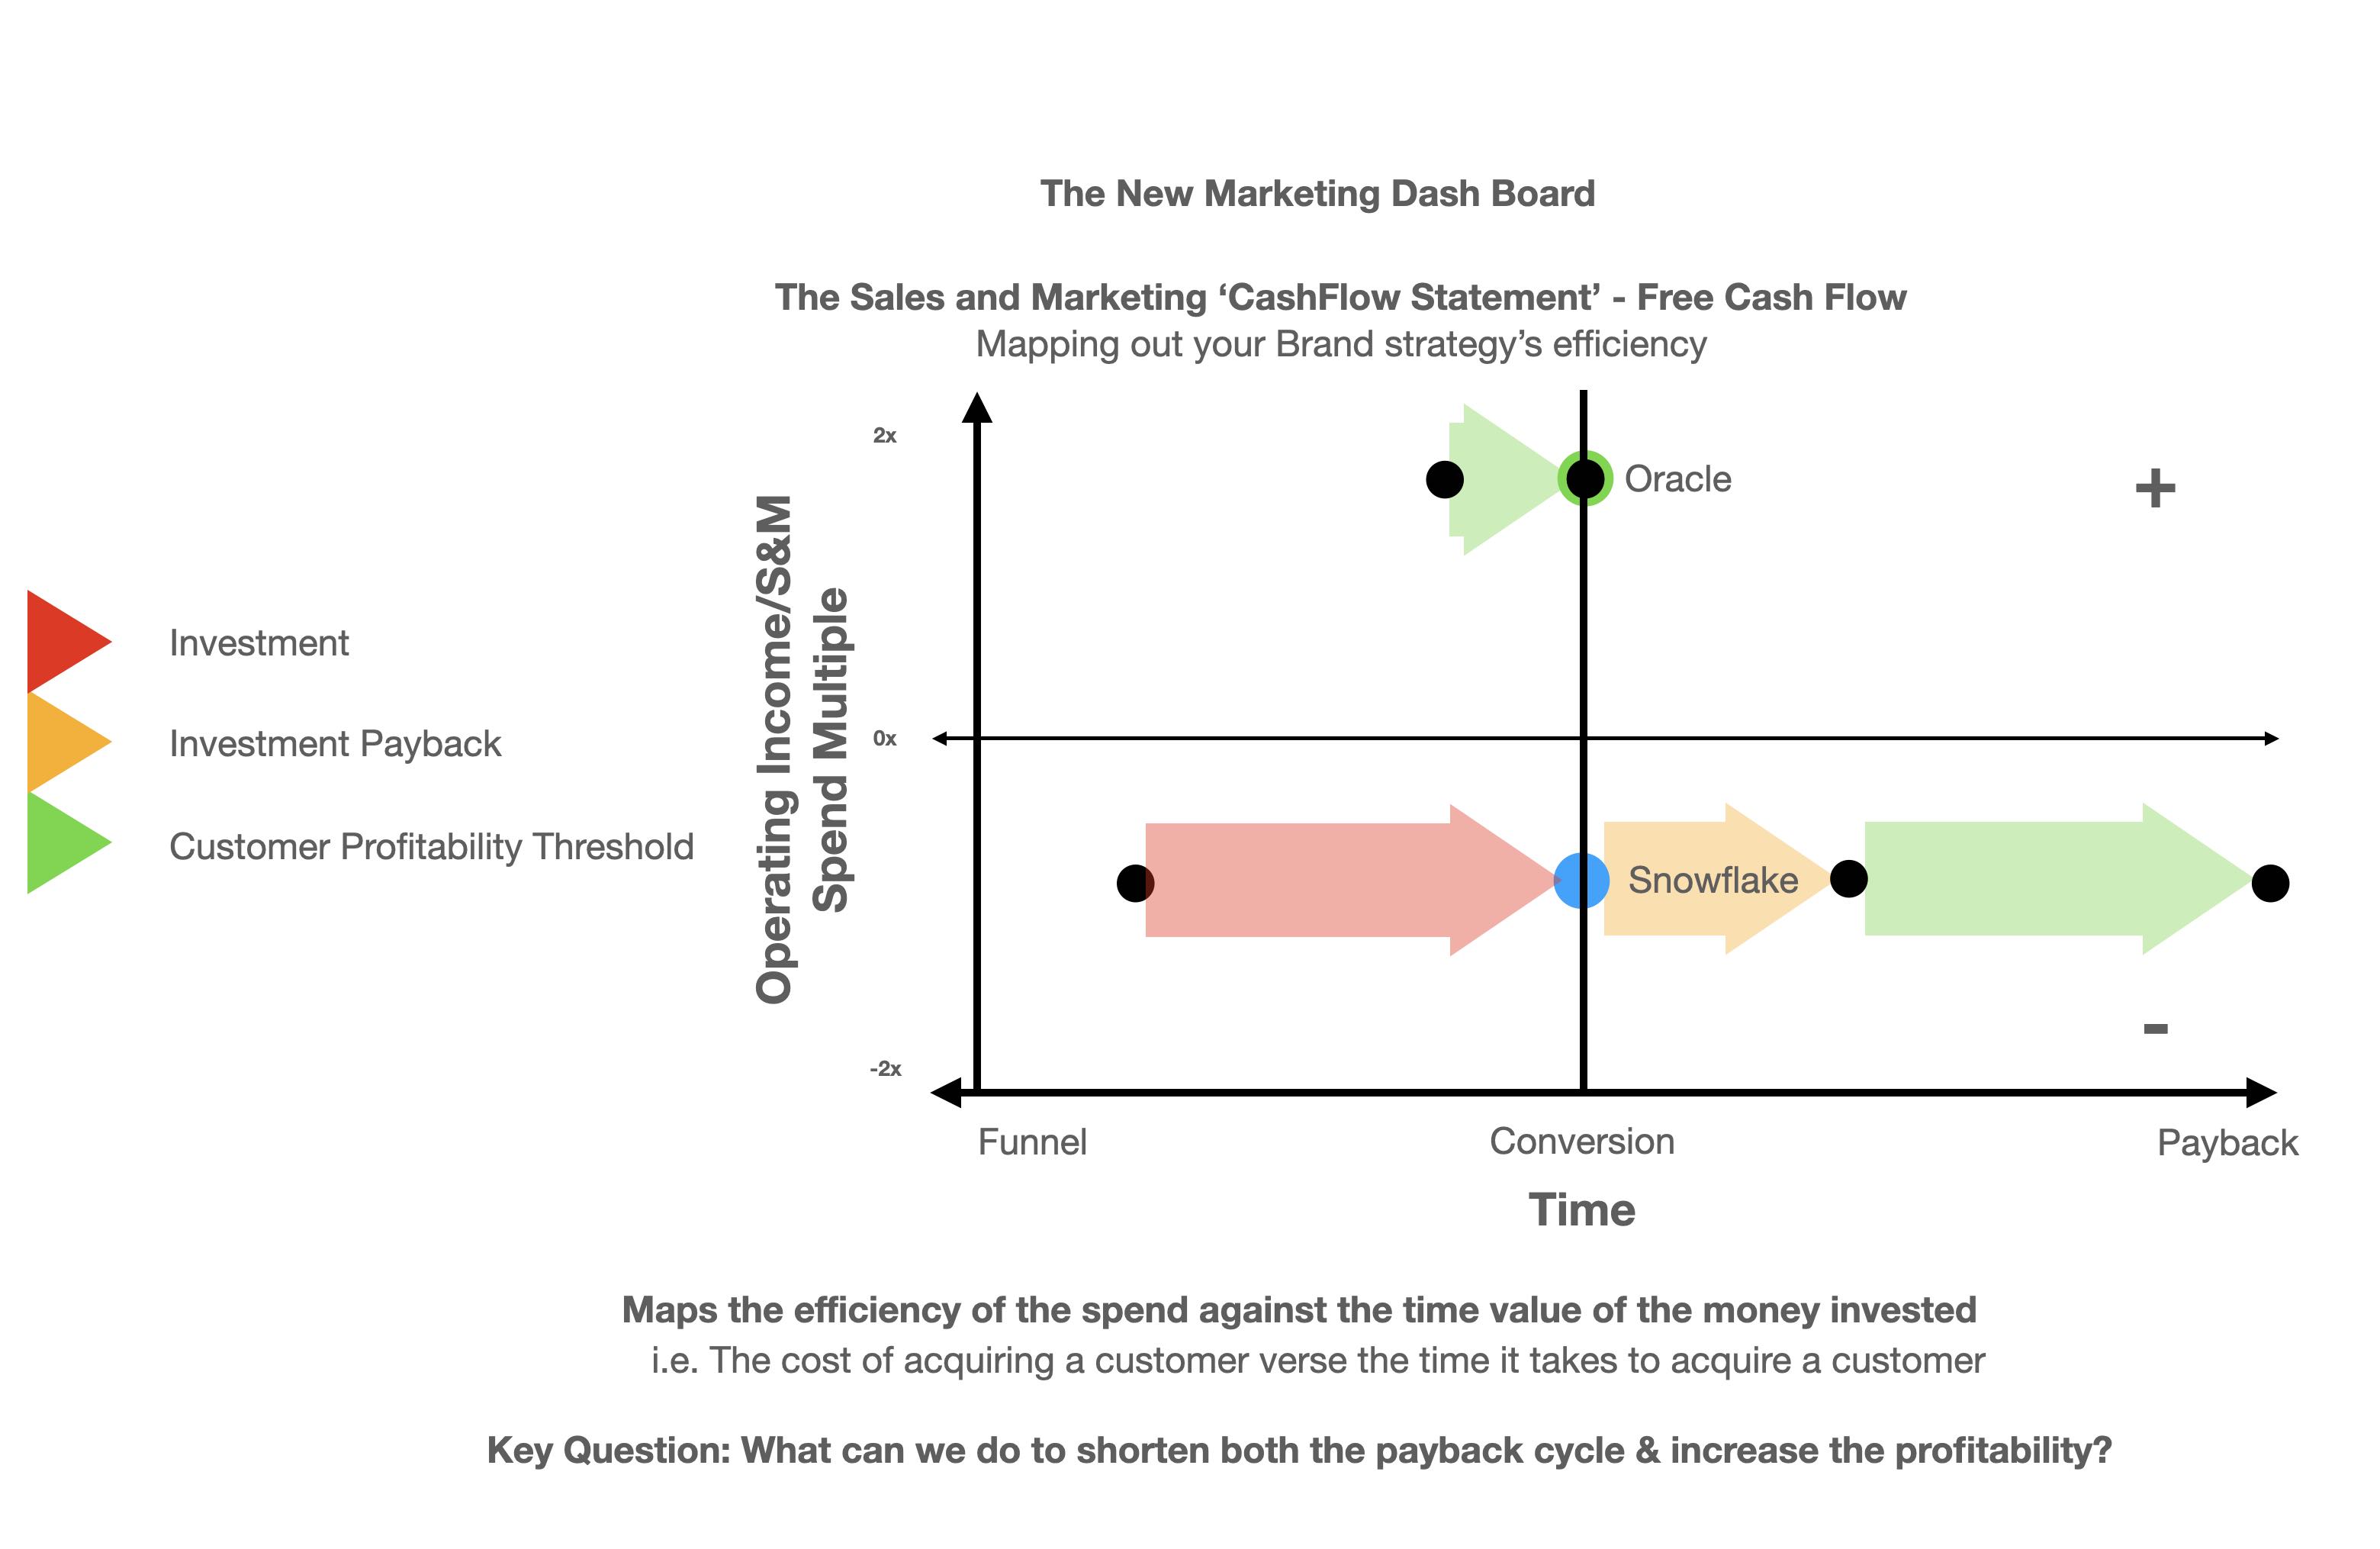
and we can take this one step further by mapping the 'Free Cashflows' - ie the profitability of the model
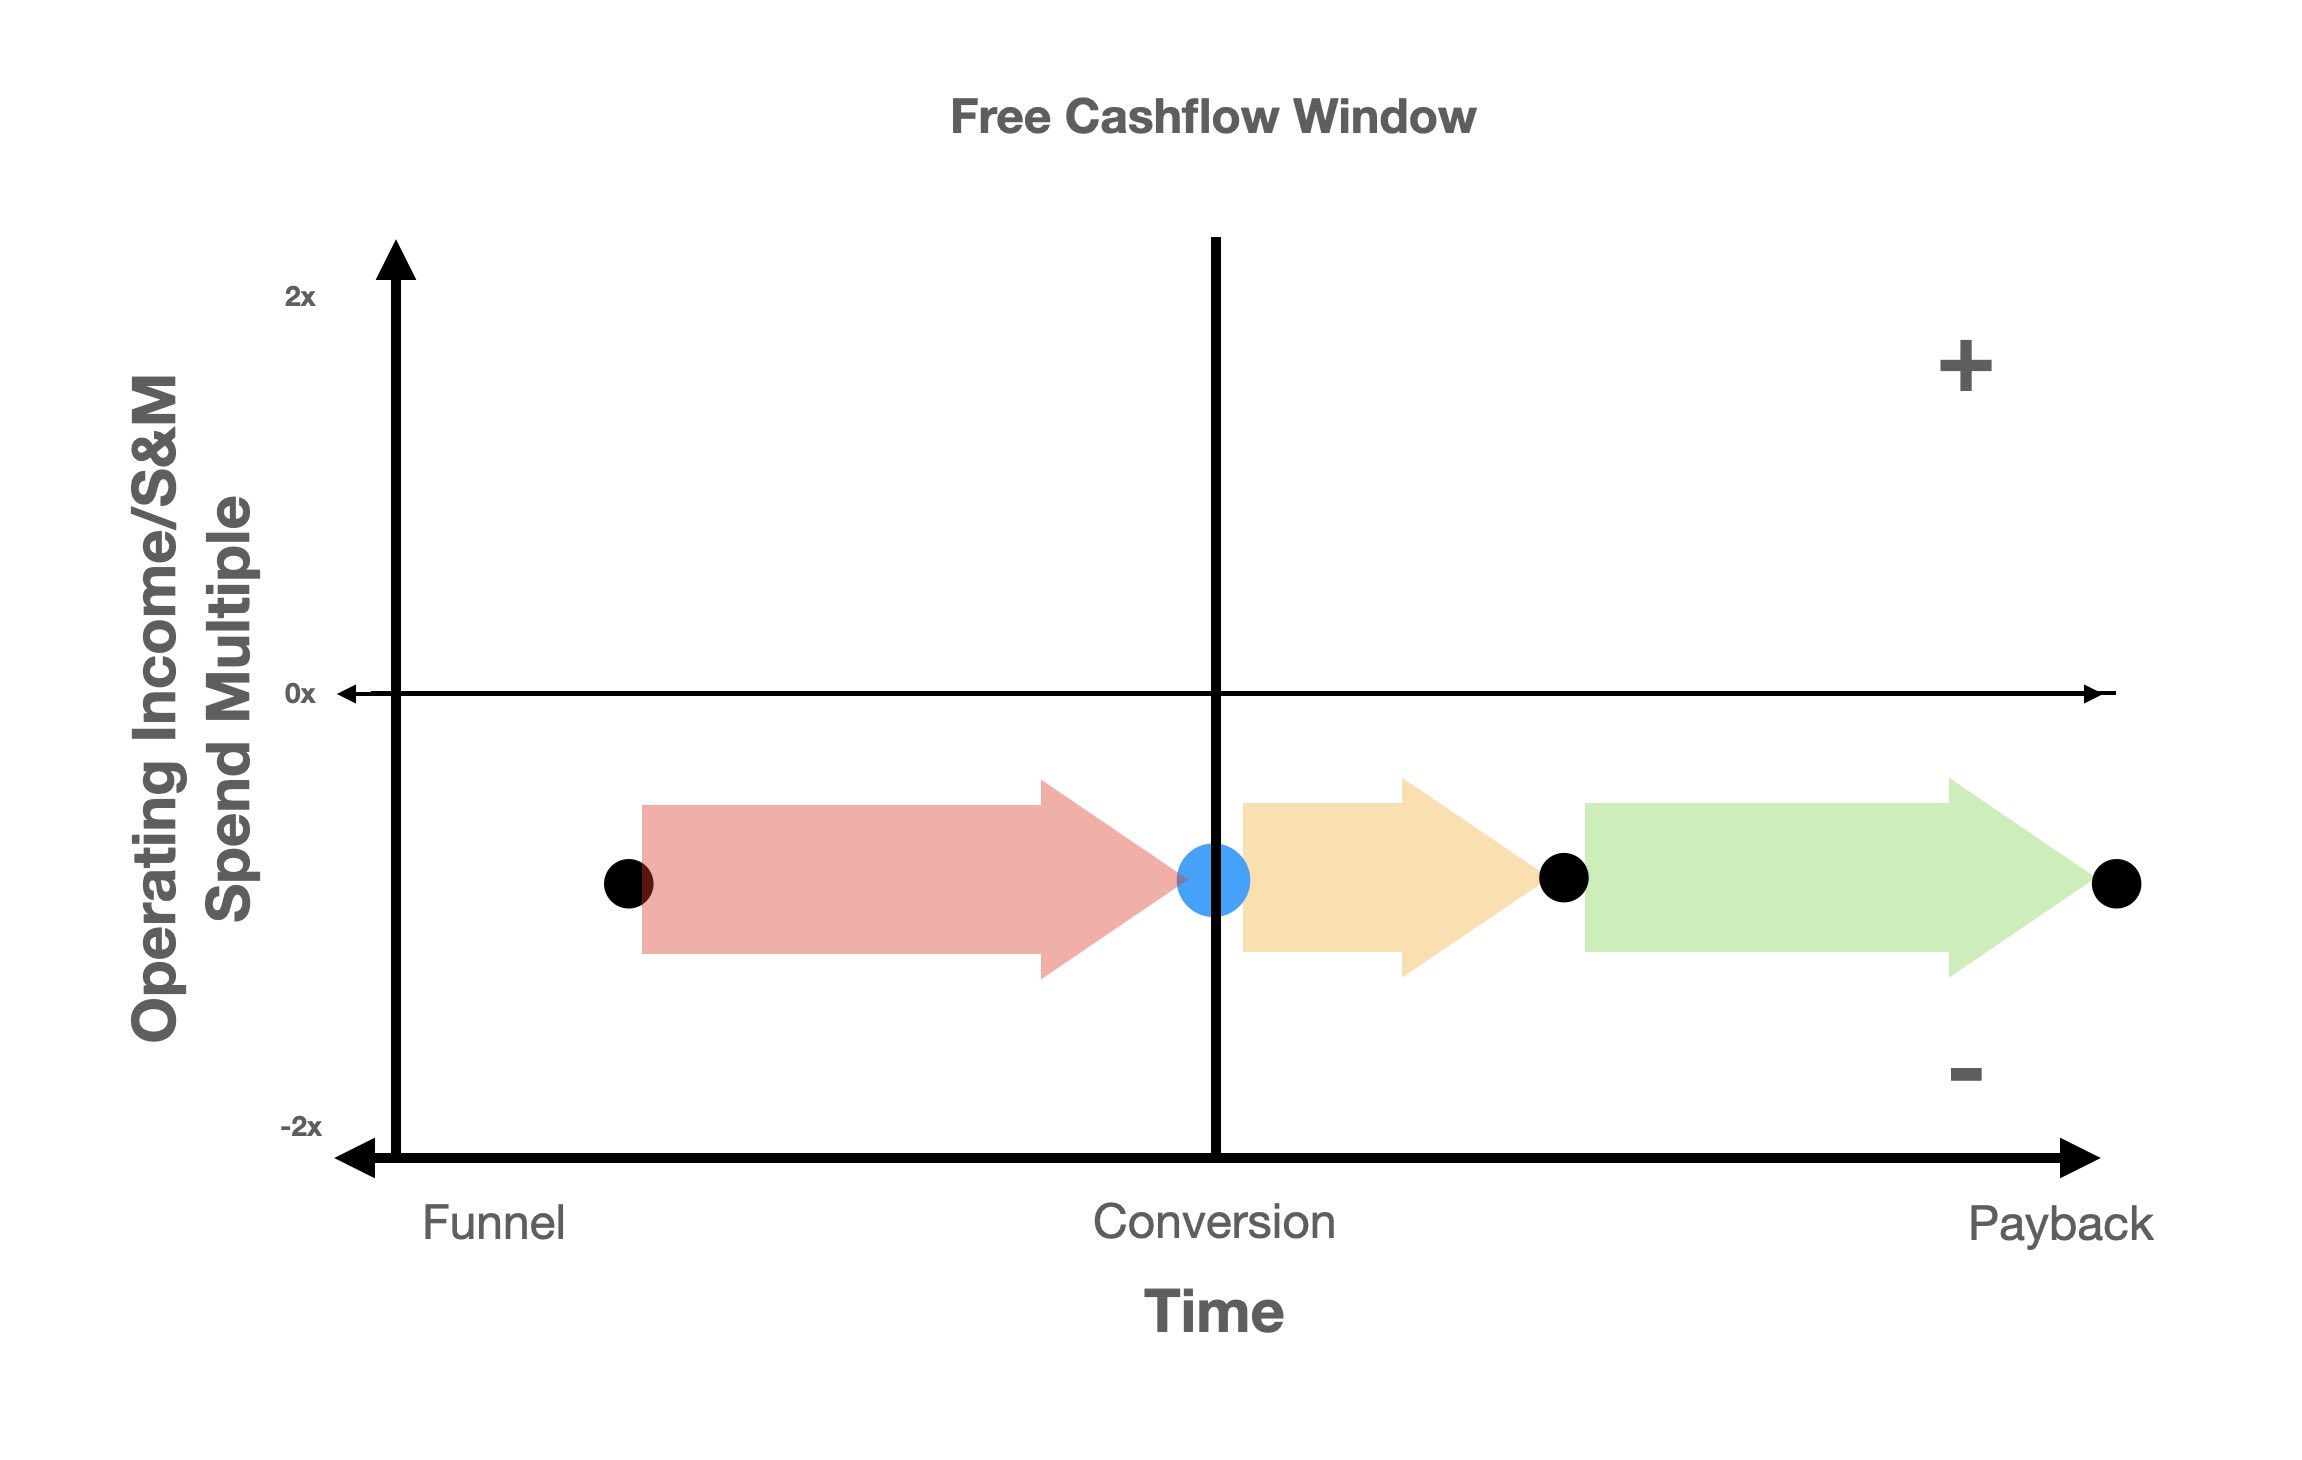
The advantage being once we have done this we can clearly see what phase of the acquisition funnel needs to be optimised to maximise the time value of the money being spent on acquiring and retaining customers
Only then do they look at the sales and marketing budget to see if it is aligned to the strategic objectives we have mapped out in the new Sales and Marketing Balance Sheet, Operating Statement and the Cashflow statement
The New Sales & Marketing Report & Budget Summary
The New Sales & Marketing Report & Budget is broken down across 4 columns
LTM - Last Twelve Months
NTM - Next Twelve Months (Forecast)
LQTR = Last 3 Months
NQTR = Next 3 Months (Forecast)
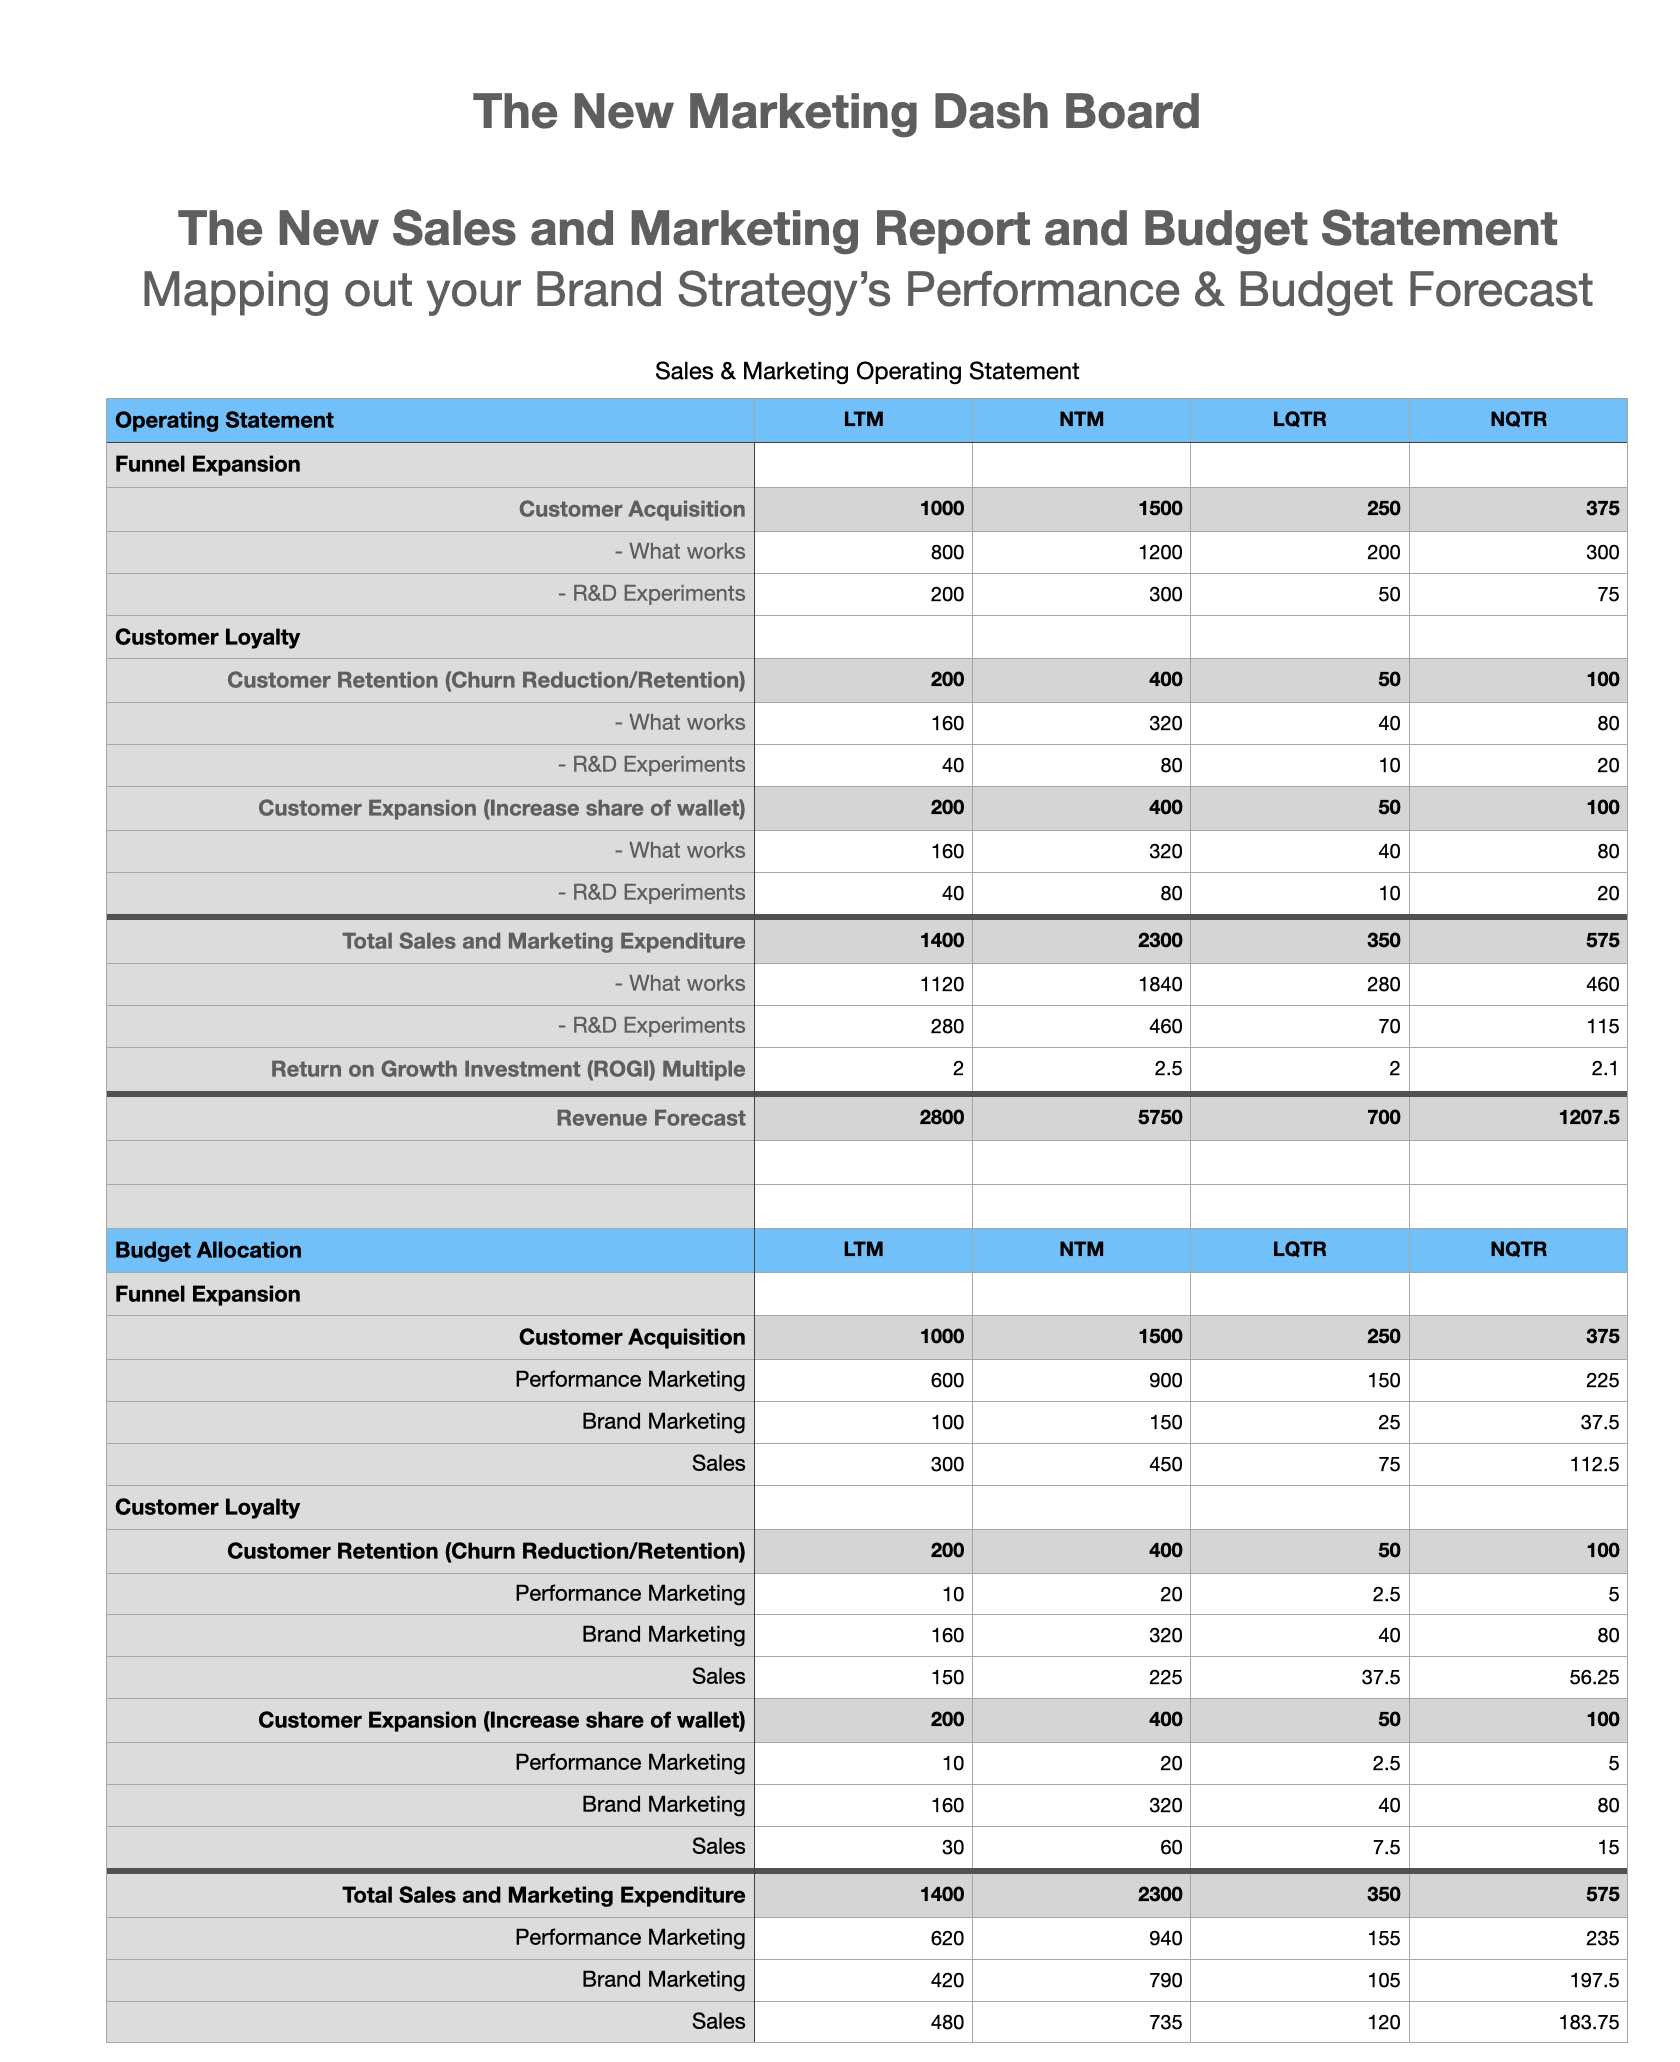
You will notice the absence of the popular marketing metrics
There is no cost per lead, no share of voice, no click through rate, on return on ads spend, no customer lifetime value, no multi-touch attribution, no bounce rate, no net present score, no brand awareness, no customer engagement, no conversion rate, no average order value, no churn rate, dwell rate, time spent on site or ARPU
All we are dealing with is optimising the time value of the money being spent on sales and marketing to the brand's growth strategy
We have redefine sales and marketing as the business of leveraging market friction to our advantage
and when we say friction we are of course talking about how we leverage trust, build trust and/or accelerate trust... to change market friction in favour of the brand
Why? Because all the CFO needs to know is why and when you need the money to achieve the growth outcome mapped to the change in phases
We have replaced the ever popular, mostly intangible, touchy feely marketing metrics with the fundamentals of portfolio management
The New Marketing Dashboard Example
Now let's take a look at this model in action
The Balance Sheet
We'll compare Oracle (the enterprise database incumbent) with Snowflake (the cloud distruptor)
First the Balance Sheet/Boston Box
We see that Oracle has 20% market share and 18% YoY Growth while Snowflake has 2% market share at 69% YoY Growth
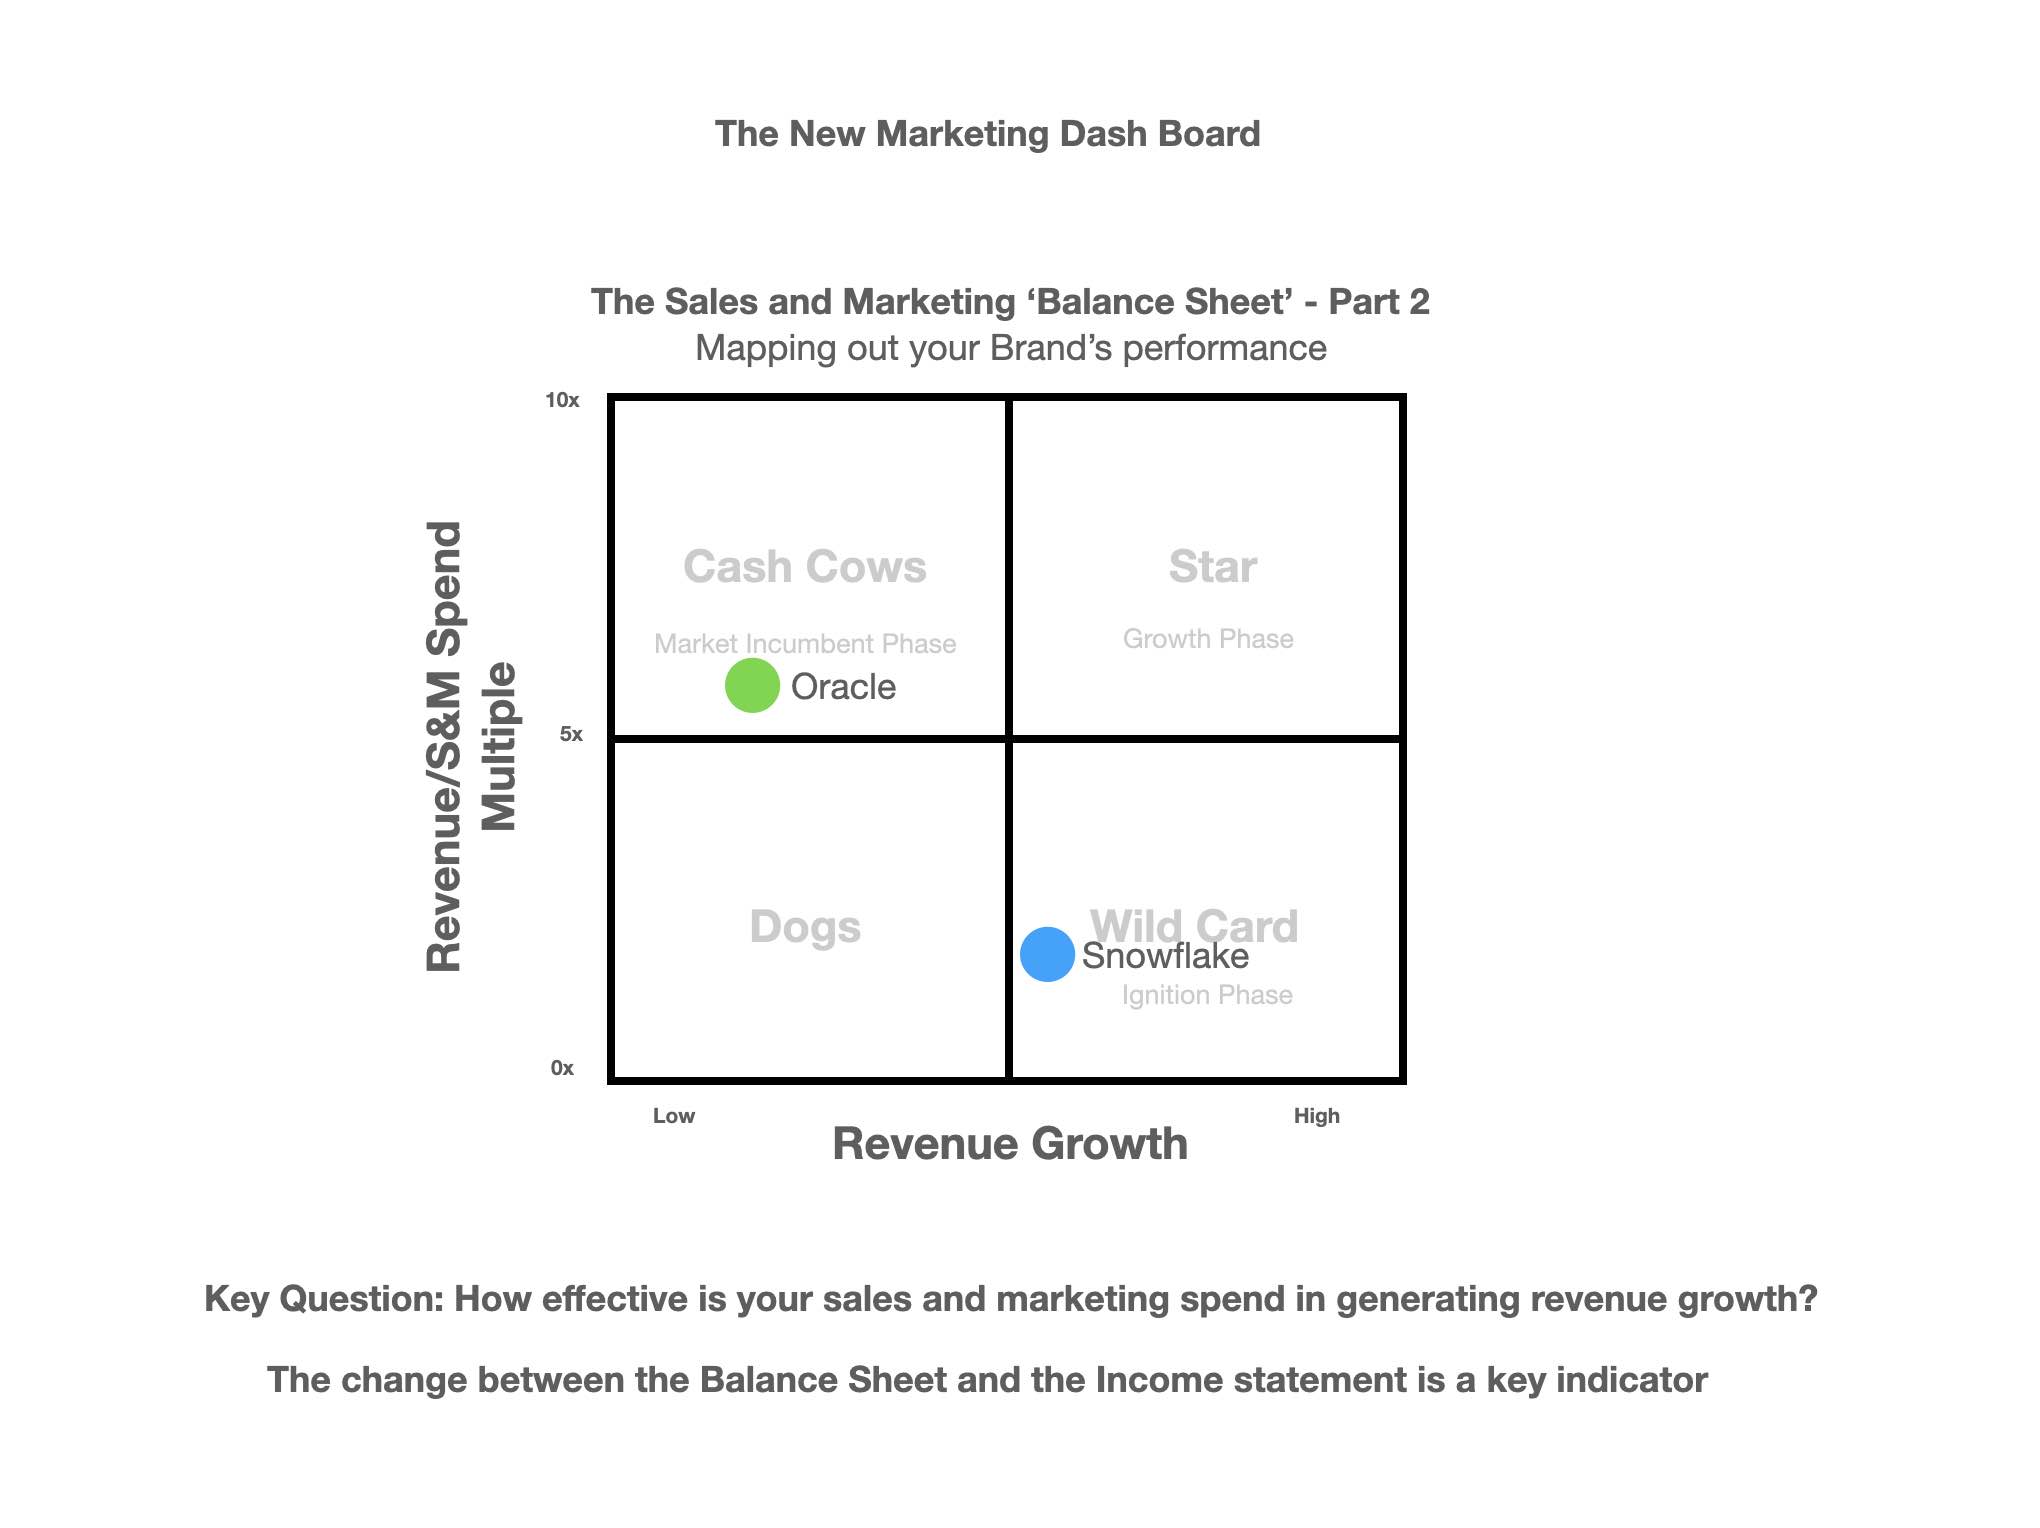
Next the Balance Sheet adjusted to reflect brand efficiency
We see very little variance between the two Balance Sheets but it appears Snowflake's Rev/S&M Multiple of 1.9x is slightly higher than anticipated
Oracle has a REV/S&M Multiple of 5.7x.
The Operating Statement
Now let's take a look at the "Operating Statement'
The darker dot represents the change in growth over the past 12 months vs the previous 12 months prior vs the change in spend
The lighter dot reprsents the YoY revenue growth vs change in spending (ie benchmark)
We can see Oracle's investment in maintaining its moat
While Snowflake is investing more in sales and marketing to build its brand even as its growth rapidly fades
The CashFlow Statement
Finally let's tale a look at the 'Cashflow Statement'
We can see how the incumbent is leveraging its trusted brand to add market friction while reducing its sales cycle and roadmap to customer profitability
Meanwhile the disruptor is challenged with removing friction from the equation
The market challenge is reducing the time and cost it takes to gain the customer's trust
Plus the added burden of subsiding the customer's usage post sale through the cloud subscription model
We can take this 'cashflow' map one step further by switching the variable in the Rev vs S&M Spend calculation from Revenue to Operating Income or 'Profit'
Once we do this we can get some insight into each company's relative ability to generate 'free cashflow' from their sales and marketing efforts
Summary
The 5 charts reveal the strategic challenge facing the two CMO's - The incumbent and the challenger
One is seeking funds to add friction to the market. The other is seeking funds to remove friction
In each case the optimal strategy will be an investment in 'Costly Signalling'
Costily Signalling Theory proposes that expensive and/or wasteful behavioural signals like those seen in nature (e.g. the male peacock’s tail serves as an indicator of sexual fitness, increasing its chances of reproductive success) serve to instil trust between the signaller and observer
The reason being an investment in 'Costly Signalling' derisks the choice for the prospective buyer
The key question for the disruptor being will increasing the Sales and Marketing spend and investing 'costly signalling' decrease the amount of time it takes to close the sale?
Will spending more on the brand image and signalling a higher level of investment in building trust improve the time value of the money invested?
These are the deeper questions of strategy facing both players... as they map the terrain and pick their battles...
Understand this and you'll understand why the wider debate over performance marketing vs. branding is not so much redundant as totally naive
i.e. What's the point in counting the number of shots fired when you don't even know where you are standing on the battlefield?